
Deploying Self-managed Elasticsearch 8 Cluster with Docker on AWS
Deploying a self-managed Elasticsearch cluster for production is a bit of pain. It’s not just about understanding the core components. You also have to manually configure availability and security. To do that, you end up jumping between many pages in the official documentation to piece everything together.
This post is a comprehensive walkthrough of deploying a self-managed Elasticsearch cluster using one of the supported installation methods: Docker. It also aims to follow production best practices and recommendations.
Planning Elasticsearch Cluster
By the end of this tutorial, you’ll have the following setup in place:
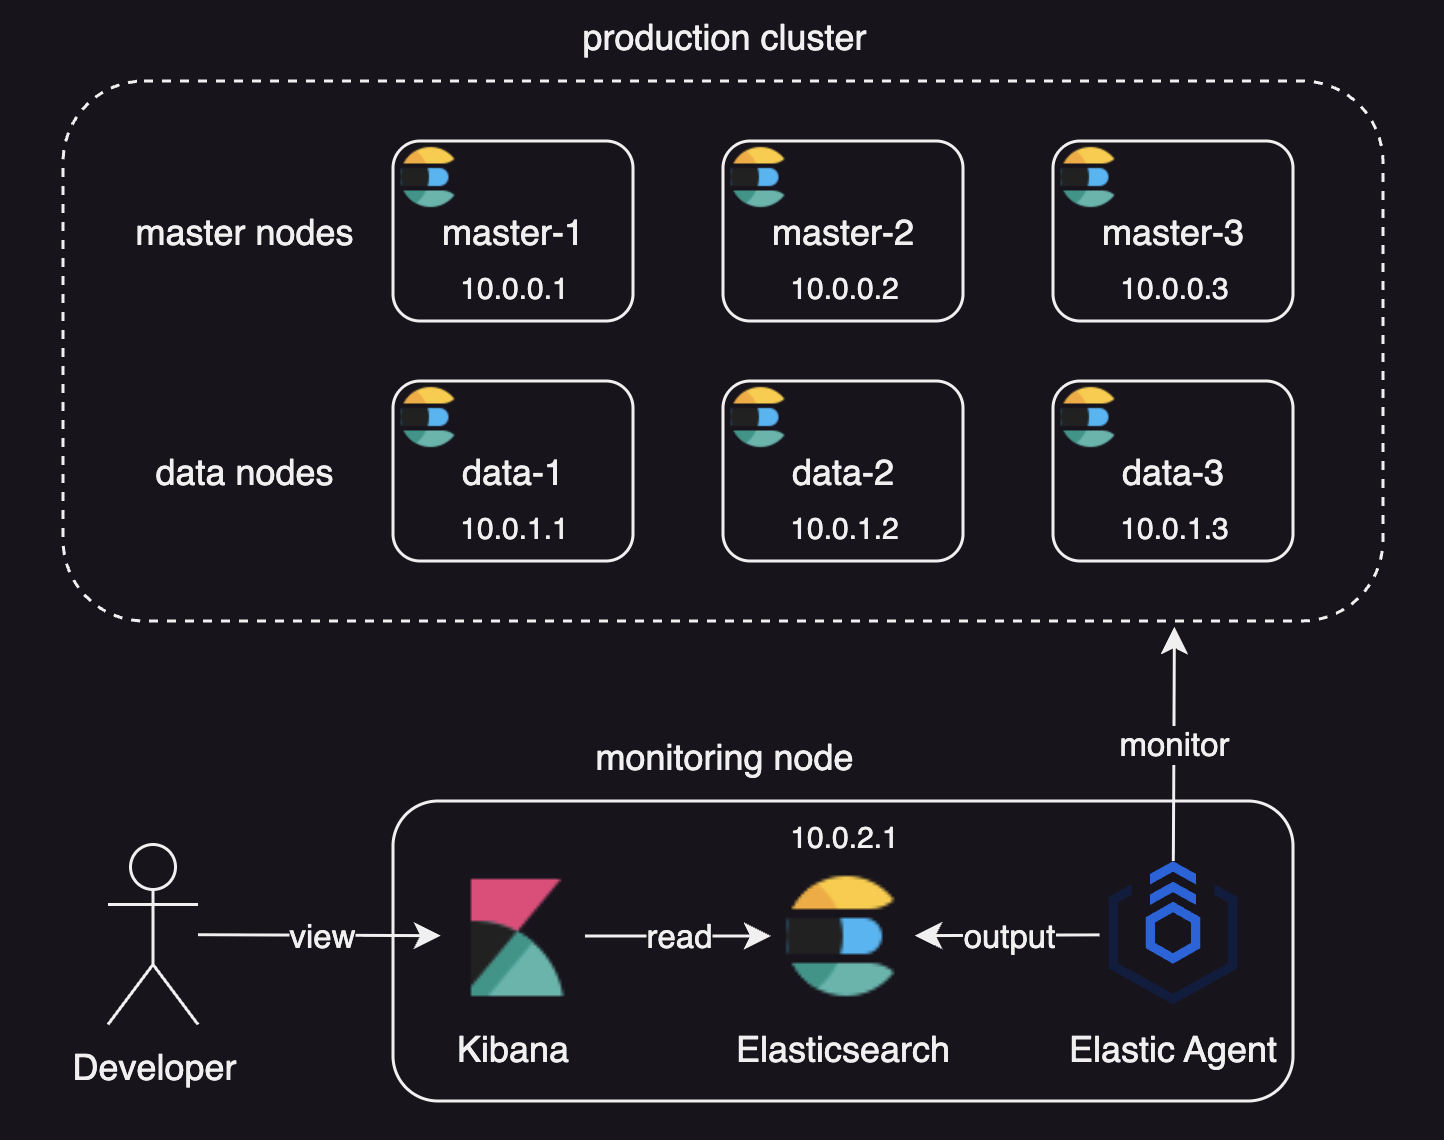
We will deploy:
- A production cluster with:
- Three master nodes, as there should normally be an odd number of master-eligible nodes in a cluster.
- Three data nodes
- A dedicated monitoring cluster with Kibana and Elastic Agent
- An optional load balancer in front of the production cluster.
About Node Roles
Here’s a quick note on node roles in this setup:
master: Responsible for lightweight cluster-wide actions such as creating or deleting an index, tracking which nodes are part of the cluster, and deciding which shards to allocate to which nodes.data: Responsible for holding data and performing data related operations such as CRUD, search, and aggregations.
We won’t use coordinating only nodes in this setup, since data nodes can happily serve the same purpose. For more details on node roles, refer to Node roles.
Why Use a Dedicated Monitoring Cluster?
Using a dedicated monitoring cluster is the recommended configuration for two key reasons:
- Production outages do not impact access to monitoring data.
- Monitoring workloads are isolated and cannot degrade production cluster performance.
Elastic also recommends using a separate Kibana instance to view a separate monitoring cluster.
For the sake of operational simplicity, this setup uses a single-node monitoring cluster. When operating at scale, however, you can also configure a more resilient multi-node monitoring cluster by following this tutorial.
Infrastructure Setup
You can skip this part if you already have servers ready to host the Elasticsearch cluster.
This tutorial has been demonstrated using the following setup:
- Elastic Stack version: 8.19.7.
- VPN access: A VPN for secure configuration and access to the Elasticsearch cluster, using the CIDR block
10.0.0.0/8
Create a Security Group
Log in to the AWS Management Console and navigate to EC2 -> Security Groups -> Create security group.
Create a security group named my-elasticsearch-node for the Elasticsearch nodes, and configure the following inbound rules:
| Type | Protocol | Port range | Source | Description - optional |
|---|---|---|---|---|
| SSH | TCP | 22 | 10.0.0.0/8 | |
| Custom TCP | TCP | 5601 | 10.0.0.0/8 | Kibana |
| Custom TCP | TCP | 9200 | 10.0.0.0/8 | HTTP port for REST clients to communicate with Elasticsearch |
| Custom TCP | TCP | 9300 | 10.0.0.0/8 | Transport port for nodes to communicate with one another |
Create a Launch Template
Create a Launch Template to make it easier to add multiple nodes to the cluster.
Go to EC2 → Launch Templates → Create launch template, then configure the following:
- Launch template name:
my-elasticsearch-node - Launch template contents:
- Amazon Machine Image (AMI):
Ubuntu Server 24.04 LTS (HVM), SSD Volume Type - Architecture:
64-bit (Arm)
- Amazon Machine Image (AMI):
- Network settings:
- Security groups:
my-elasticsearch-node
- Security groups:
- Storage:
- Size: 100 GiB
This configuration is just an example.
You can adjust the values to match your own requirements.
Just make sure to select the security group created in the previous step, that is my-elasticsearch-node.
Launch Instances
- Go to EC2 -> Instances -> Launch instance from template and configure the following:
- Source template:
my-elasticsearch-node - Instance type: (Your choice. For this tutorial, the monitoring node requires at least 8 GiB of RAM.)
- Key pair (login): Select your key pair.
- Resource tags:
- Key:
Name(for identifying instances) - Value:
my-elasticsearch-node
- Key:
- Number of instances:
7(6 for the production cluster and 1 for the monitoring node)
- Source template:
- Click
Launch instance - Go to EC2 -> Instances -> Search
my-elasticsearch-nodeand update theNametags as follows:my-elasticsearch-node-master-1my-elasticsearch-node-master-2my-elasticsearch-node-master-3my-elasticsearch-node-data-1my-elasticsearch-node-data-2my-elasticsearch-node-data-3my-elasticsearch-node-monitoring
- Retrieve the private IP addresses of all EC2 instances using the AWS CLI:
 aws ec2 describe-instances \
     --filters "Name=tag:Name,Values=my-elasticsearch-node-*" \
     --query "Reservations[].Instances[].[Tags[?Key=='Name'].Value | [0], PrivateIpAddress]" \
     --output text \
     --no-cli-pager
Output:
my-elasticsearch-node-master-1 10.0.0.1 my-elasticsearch-node-master-2 10.0.0.2 my-elasticsearch-node-master-3 10.0.0.3 my-elasticsearch-node-data-1 10.0.1.1 my-elasticsearch-node-data-2 10.0.1.2 my-elasticsearch-node-data-3 10.0.1.3 my-elasticsearch-node-monitoring 10.0.2.1 - Update SSH config file (usually
~/.ssh/config) to connect to the instances from your local environment:Host my-elasticsearch-node-* User ubuntu IdentityFile your_key.pem Host my-elasticsearch-node-master-1 HostName 10.0.0.1 Host my-elasticsearch-node-master-2 HostName 10.0.0.2 Host my-elasticsearch-node-master-3 HostName 10.0.0.3 Host my-elasticsearch-node-data-1 HostName 10.0.1.1 Host my-elasticsearch-node-data-2 HostName 10.0.1.2 Host my-elasticsearch-node-data-3 HostName 10.0.1.3 Host my-elasticsearch-node-monitoring HostName 10.0.2.1
The IP addresses used in this tutorial are simplified for clarity. Your IP addresses will differ depending on your VPC and subnet configuration.
Deploying an Elasticsearch cluster
Initializing the Cluster with Master Nodes
- Connect to
my-elasticsearch-node-master-1:ssh my-elasticsearch-node-master-1 - Install Docker 7:
sudo apt-get update sudo apt-get install -y ca-certificates curl sudo install -m 0755 -d /etc/apt/keyrings sudo curl -fsSL https://download.docker.com/linux/ubuntu/gpg -o /etc/apt/keyrings/docker.asc sudo chmod a+r /etc/apt/keyrings/docker.asc echo \ "deb [arch=$(dpkg --print-architecture) signed-by=/etc/apt/keyrings/docker.asc] https://download.docker.com/linux/ubuntu \ $(. /etc/os-release && echo "${UBUNTU_CODENAME:-$VERSION_CODENAME}") stable" | \ sudo tee /etc/apt/sources.list.d/docker.list > /dev/null sudo apt-get update sudo apt-get install -y docker-ce docker-ce-cli containerd.io docker-buildx-plugin docker-compose-plugin sudo usermod -aG docker ${USER} - Set
vm.max_map_countto at least262144:sudo sysctl -w vm.max_map_count=262144 # Add `vm.max_map_count` to `sysctl.conf` echo "vm.max_map_count=262144" | sudo tee -a /etc/sysctl.conf- This is to increase the limits on
mmapcounts to avoid out of memory exceptions:
- This is to increase the limits on
- Prepare local directories for storing data and logs through a bind-mount:
mkdir esdatadir && chmod g+rwx esdatadir && sudo chgrp 0 esdatadir mkdir eslogsdir && chmod g+rwx eslogsdir && sudo chgrp 0 eslogsdir - Prepare a certificate directory:
mkdir certs && chmod g+rwx certs && sudo chgrp 0 certs - Generate CA (only if it doesn’t exist - first node should create and share with others):
sudo apt-get install -y unzip sudo docker run --rm \ -v $HOME/certs:/usr/share/elasticsearch/config/certs \ docker.elastic.co/elasticsearch/elasticsearch:8.19.7 \ bin/elasticsearch-certutil ca --silent --pem --out /usr/share/elasticsearch/config/certs/ca.zip cd $HOME/certs && unzip -o ca.zip && mv ca/* . && rmdir ca && rm ca.zip - Generate node certificate signed by CA:
ES_NETWORK_HOST=$(hostname -I | awk '{print $1}') sudo docker run --rm \ -v $HOME/certs:/usr/share/elasticsearch/config/certs \ docker.elastic.co/elasticsearch/elasticsearch:8.19.7 \ bin/elasticsearch-certutil cert --silent --pem \ --ca-cert /usr/share/elasticsearch/config/certs/ca.crt \ --ca-key /usr/share/elasticsearch/config/certs/ca.key \ --dns master-1,localhost \ --ip ${ES_NETWORK_HOST},127.0.0.1 \ --out /usr/share/elasticsearch/config/certs/node.zip cd $HOME/certs && unzip -o node.zip && mv instance/* . && rmdir instance && rm node.zip - Create a custom
elasticsearch.ymlin your home directory with important settings:cluster.name: my-elasticsearch-cluster node.roles: master node.name: master-1 network.host: 0.0.0.0 discovery.seed_hosts: 10.0.0.1,10.0.0.2,10.0.0.3 cluster.initial_master_nodes: master-1,master-2,master-3 xpack.security.enabled: true xpack.security.transport.ssl.enabled: true xpack.security.transport.ssl.verification_mode: certificate xpack.security.transport.ssl.key: certs/instance.key xpack.security.transport.ssl.certificate: certs/instance.crt xpack.security.transport.ssl.certificate_authorities: certs/ca.crt- The configuration files should contain settings which are node-specific (such as
node.nameand paths), or settings which a node requires in order to be able to join a cluster (such ascluster.nameandnetwork.host), as most settings can be changed on a running cluster using the Cluster update settings API. cluster.name: A node can only join a cluster when it shares itscluster.namewith all the other nodes in the cluster. The default name iselasticsearch, but you should change it to an appropriate name that describes the purpose of the cluster.node.roles: We set the role tomasterto create a dedicated master-eligible node. This is the most reliable way to avoid overloading the master with other tasks.node.name: Elasticsearch usesnode.nameas a human-readable identifier for a particular instance of Elasticsearch. The node name defaults to the hostname of the machine when Elasticsearch starts.network.host: Sets the address of this node for both HTTP and transport traffic.discovery.seed_hosts: When you want to form a cluster with nodes on other hosts, this setting provides a list of other nodes in the cluster that are master-eligible and likely to be live and contactable to seed the discovery process.cluster.initial_master_nodes: A list of node names of master-eligible nodes whose votes are counted in the first election. Do not configure this setting on master-ineligible nodes or nodes joining an existing cluster.xpack.security.enabled: Settrueto install Elastic Agent for stack monitoring.xpack.security.transport.ssl.enabled: Settrueas transport SSL must be enabled if security is enabled.- For a full list of configuration options, refer to Elasticsearch configuration reference.
- The configuration files should contain settings which are node-specific (such as
- Run Elasticsearch container:
sudo docker run -d \
    --restart always \
    --group-add 0 \
    --volume $HOME/esdatadir:/usr/share/elasticsearch/data \
    --volume $HOME/eslogsdir:/usr/share/elasticsearch/logs \
    --volume $HOME/certs:/usr/share/elasticsearch/config/certs:ro \
    --ulimit nofile=65535:65535 \
    --env "bootstrap.memory_lock=true" --ulimit memlock=-1:-1 \
    --publish-all \
    --network host \
    --volume $HOME/elasticsearch.yml:/usr/share/elasticsearch/config/elasticsearch.yml \
    --env TZ=Asia/Seoul \
    --env ELASTIC_PASSWORD=elasticpassword \
    --name elasticsearch \
    docker.elastic.co/elasticsearch/elasticsearch:8.19.7
--restart always: to automatically restarts the container if it stops.--group-add 0: to ensure that the user under which Elasticsearch is running has file permissions toesdatadir.--volume $HOME/...: to persist data, logs, and certificates across container restarts.--ulimit nofile=65535:65535: to increase the file descriptor limit required for production workloads.--publish-all: to randomize published ports, which is recommended for production clusters.--network host: to optimize performance. Thehostnetwork only works on Linux hosts and--publish-alloption is ignored when it is enabled.--volume $HOME/...: to bind-mount customelasticsearch.yml, the preferred approach for production setups.--env "bootstrap.memory_lock=true" --ulimit memlock=-1:-1: to disable swapping for performance and node stability.--env TZ=Asia/Seoul: Sets the container timezone (adjust as needed).ELASTIC_PASSWORD: Replace it with a password for your production Elasticsearch cluster.- Some setups use
ES_JAVA_OPTS, but this is not recommended for production. Use the default Elasticsearch memory settings instead.
At this stage, the cluster isn’t fully formed yet, so you’ll see a warning in the container logs like:
master not discovered yet, this node has not previously joined a bootstrapped cluster, and this node must discover master-eligible nodes [master-1, master-2, master-3] to bootstrap a cluster: ...
You won’t see this error if you’re using only a single master-eligible node.
This happens because we configured three initial master nodes—master-1, master-2, and master-3—but only master-1 has joined the cluster so far. Elasticsearch is still waiting for the remaining master-eligible nodes before it can complete the bootstrap process.
To finish forming the cluster, you need to bring up and join the other master-eligible nodes (master-2 and master-3) as well.
Joining Master Nodes to the Cluster
- Copy
certs/ca.crtandcerts/ca.keyfiles to your local machine or another secure location. These will be reused when setting up the remaining nodes. - Connect to
my-elasticsearch-node-master-2:ssh my-elasticsearch-node-master-2 - Copy
ca.crtandca.keyinto the home directory on this node. - Install docker, set
vm.max_map_count, prepare local directories, and generate node certificate:# install docker sudo apt-get update sudo apt-get install -y ca-certificates curl unzip sudo install -m 0755 -d /etc/apt/keyrings sudo curl -fsSL https://download.docker.com/linux/ubuntu/gpg -o /etc/apt/keyrings/docker.asc sudo chmod a+r /etc/apt/keyrings/docker.asc echo \ "deb [arch=$(dpkg --print-architecture) signed-by=/etc/apt/keyrings/docker.asc] https://download.docker.com/linux/ubuntu \ $(. /etc/os-release && echo "${UBUNTU_CODENAME:-$VERSION_CODENAME}") stable" | \ sudo tee /etc/apt/sources.list.d/docker.list > /dev/null sudo apt-get update sudo apt-get install -y docker-ce docker-ce-cli containerd.io docker-buildx-plugin docker-compose-plugin sudo usermod -aG docker ${USER} # Set `vm.max_map_count` to at least 262144 sudo sysctl -w vm.max_map_count=262144 echo "vm.max_map_count=262144" | sudo tee -a /etc/sysctl.conf # Prepare a local directory for storing data and logs through a bind-mount mkdir esdatadir && chmod g+rwx esdatadir && sudo chgrp 0 esdatadir mkdir eslogsdir && chmod g+rwx eslogsdir && sudo chgrp 0 eslogsdir # Prepare certificate directory mkdir certs && chmod g+rwx certs && sudo chgrp 0 certs mv ca.crt certs/ mv ca.key certs/ # Generate node certificate signed by CA ES_NETWORK_HOST=$(hostname -I | awk '{print $1}') sudo docker run --rm \ -v $HOME/certs:/usr/share/elasticsearch/config/certs \ docker.elastic.co/elasticsearch/elasticsearch:8.19.7 \ bin/elasticsearch-certutil cert --silent --pem \ --ca-cert /usr/share/elasticsearch/config/certs/ca.crt \ --ca-key /usr/share/elasticsearch/config/certs/ca.key \ --dns master-2,localhost \ --ip ${ES_NETWORK_HOST},127.0.0.1 \ --out /usr/share/elasticsearch/config/certs/node.zip cd $HOME/certs && unzip -o node.zip && mv instance/* . && rmdir instance && rm node.zip - Create a custom
elasticsearch.ymlin your home directory:cluster.name: my-elasticsearch-cluster node.roles: master node.name: master-2 network.host: 0.0.0.0 discovery.seed_hosts: 10.0.0.1,10.0.0.2,10.0.0.3 xpack.security.enabled: true xpack.security.transport.ssl.enabled: true xpack.security.transport.ssl.verification_mode: certificate xpack.security.transport.ssl.key: certs/instance.key xpack.security.transport.ssl.certificate: certs/instance.crt xpack.security.transport.ssl.certificate_authorities: certs/ca.crtnode.name: now set tomaster-2
- Run Elasticsearch container:
 sudo docker run -d \
     --restart always \
     --group-add 0 \
     --volume $HOME/esdatadir:/usr/share/elasticsearch/data \
     --volume $HOME/eslogsdir:/usr/share/elasticsearch/logs \
     --volume $HOME/certs:/usr/share/elasticsearch/config/certs:ro \
     --ulimit nofile=65535:65535 \
     --env "bootstrap.memory_lock=true" --ulimit memlock=-1:-1 \
     --publish-all \
     --network host \
     --volume $HOME/elasticsearch.yml:/usr/share/elasticsearch/config/elasticsearch.yml \
     --env TZ=Asia/Seoul \
     --env ELASTIC_PASSWORD=elasticpassword \
     --name elasticsearch \
     docker.elastic.co/elasticsearch/elasticsearch:8.19.7
--env TZ=Asia/Seoul: Sets the container timezone (adjust as needed).ELASTIC_PASSWORD: Replace it with a password for your production Elasticsearch cluster.
- Connect to
my-elasticsearch-node-master-3and repeat steps 13-16, making sure to setnode.nametomaster-3in theelasticsearch.ymlfile. - Verify that the master nodes have formed a cluster:
curl -u elastic:elasticpassword "http://localhost:9200/_cat/nodes?v&s=name"Output:
 ip             heap.percent ram.percent cpu load_1m load_5m load_15m node.role master name
 10.0.0.1                 40          98   0    0.00    0.05     0.07 m         *      master-1
 10.0.0.2                 26          98   0    0.07    0.17     0.10 m         -      master-2
 10.0.0.3                 24          98   0    0.39    0.31     0.13 m         -      master-3
Since there are no data nodes to host shards yet, the cluster health will show up as red:
curl http://elastic:elasticpassword@localhost:9200/_cluster/health
Output:
{
    "cluster_name": "my-elasticsearch-cluster",
    "status": "red",
    "timed_out": false,
    "number_of_nodes": 3,
    "number_of_data_nodes": 0,
    "active_primary_shards": 0,
    "active_shards": 0,
    "relocating_shards": 0,
    "initializing_shards": 0,
    "unassigned_shards": 2,
    "unassigned_primary_shards": 2,
    "delayed_unassigned_shards": 0,
    "number_of_pending_tasks": 0,
    "number_of_in_flight_fetch": 0,
    "task_max_waiting_in_queue_millis": 0,
    "active_shards_percent_as_number": 0.0
}
This is expected.
Once the data nodes join the cluster, Elasticsearch will be able to allocate shards and the status should move to yellow or green depending on replica allocation.
Joining Data Nodes to the Cluster
The process for adding a data node is very similar to adding a master node, with a few small changes in the elasticsearch.yml configuration.
- Connect to
my-elasticsearch-node-data-1:ssh my-elasticsearch-node-data-1 - Copy
ca.crtandca.keyinto the home directory on this node. - Install docker, set
vm.max_map_count, prepare local directories, and generate node certificate:# install docker sudo apt-get update sudo apt-get install -y ca-certificates curl unzip sudo install -m 0755 -d /etc/apt/keyrings sudo curl -fsSL https://download.docker.com/linux/ubuntu/gpg -o /etc/apt/keyrings/docker.asc sudo chmod a+r /etc/apt/keyrings/docker.asc echo \ "deb [arch=$(dpkg --print-architecture) signed-by=/etc/apt/keyrings/docker.asc] https://download.docker.com/linux/ubuntu \ $(. /etc/os-release && echo "${UBUNTU_CODENAME:-$VERSION_CODENAME}") stable" | \ sudo tee /etc/apt/sources.list.d/docker.list > /dev/null sudo apt-get update sudo apt-get install -y docker-ce docker-ce-cli containerd.io docker-buildx-plugin docker-compose-plugin sudo usermod -aG docker ${USER} # Set `vm.max_map_count` to at least 262144 sudo sysctl -w vm.max_map_count=262144 echo "vm.max_map_count=262144" | sudo tee -a /etc/sysctl.conf # Prepare a local directory for storing data and logs through a bind-mount mkdir esdatadir && chmod g+rwx esdatadir && sudo chgrp 0 esdatadir mkdir eslogsdir && chmod g+rwx eslogsdir && sudo chgrp 0 eslogsdir # Prepare certificate directory mkdir certs && chmod g+rwx certs && sudo chgrp 0 certs mv ca.crt certs/ mv ca.key certs/ # Generate node certificate signed by CA ES_NETWORK_HOST=$(hostname -I | awk '{print $1}') sudo docker run --rm \ -v $HOME/certs:/usr/share/elasticsearch/config/certs \ docker.elastic.co/elasticsearch/elasticsearch:8.19.7 \ bin/elasticsearch-certutil cert --silent --pem \ --ca-cert /usr/share/elasticsearch/config/certs/ca.crt \ --ca-key /usr/share/elasticsearch/config/certs/ca.key \ --dns data-1,localhost \ --ip ${ES_NETWORK_HOST},127.0.0.1 \ --out /usr/share/elasticsearch/config/certs/node.zip cd $HOME/certs && unzip -o node.zip && mv instance/* . && rmdir instance && rm node.zip - Create a custom
elasticsearch.ymlin your home directory:cluster.name: my-elasticsearch-cluster node.roles: data node.name: data-1 network.host: 0.0.0.0 discovery.seed_hosts: 10.0.0.1,10.0.0.2,10.0.0.3 xpack.security.enabled: true xpack.security.transport.ssl.enabled: true xpack.security.transport.ssl.verification_mode: certificate xpack.security.transport.ssl.key: certs/instance.key xpack.security.transport.ssl.certificate: certs/instance.crt xpack.security.transport.ssl.certificate_authorities: certs/ca.crtnode.roles: now set todata.node.name: now set todata-1
- Run Elasticsearch container:
 sudo docker run -d \
     --restart always \
     --group-add 0 \
     --volume $HOME/esdatadir:/usr/share/elasticsearch/data \
     --volume $HOME/eslogsdir:/usr/share/elasticsearch/logs \
     --volume $HOME/certs:/usr/share/elasticsearch/config/certs:ro \
     --ulimit nofile=65535:65535 \
     --env "bootstrap.memory_lock=true" --ulimit memlock=-1:-1 \
     --publish-all \
     --network host \
     --volume $HOME/elasticsearch.yml:/usr/share/elasticsearch/config/elasticsearch.yml \
     --env TZ=Asia/Seoul \
     --env ELASTIC_PASSWORD=elasticpassword \
     --name elasticsearch \
     docker.elastic.co/elasticsearch/elasticsearch:8.19.7
--env TZ=Asia/Seoul: Sets the container timezone (adjust as needed).ELASTIC_PASSWORD: Replace it with a password for your production Elasticsearch cluster.- Joining the cluster can take a little time. Once a data node joins the cluster, the health status transitions from
redtogreen:{ "cluster_name": "my-elasticsearch-cluster", "status": "green", "timed_out": false, "number_of_nodes": 4, "number_of_data_nodes": 1, "active_primary_shards": 3, "active_shards": 3, "relocating_shards": 0, "initializing_shards": 0, "unassigned_shards": 0, "unassigned_primary_shards": 0, "delayed_unassigned_shards": 0, "number_of_pending_tasks": 0, "number_of_in_flight_fetch": 0, "task_max_waiting_in_queue_millis": 0, "active_shards_percent_as_number": 100.0 }
- Repeat steps 1-5 for
my-elasticsearch-node-data-2andmy-elasticsearch-node-data-3, updatingnode.nameto match each node. - From any node, verify that all nodes have successfully joined the cluster:
curl -u elastic:elasticpassword "http://localhost:9200/_cat/nodes?v&s=name"Output:
 ip             heap.percent ram.percent cpu load_1m load_5m load_15m node.role master name
 10.0.1.1                 41          97   0    0.00    0.06     0.08 d         -      data-1
 10.0.1.2                 36          98   0    0.22    0.33     0.16 d         -      data-2
 10.0.1.3                 33          98   0    0.14    0.24     0.11 d         -      data-3
 10.0.0.1                  8          98   0    0.00    0.00     0.00 m         *      master-1
 10.0.0.2                 44          97   0    0.00    0.00     0.00 m         -      master-2
 10.0.0.3                 42          97   0    0.00    0.00     0.00 m         -      master-3
At this point, all master and data nodes should be present, and the cluster should be fully formed and healthy.
Updating custom elasticsearch.yml
Updating a custom elasticsearch.yml in a Docker-based setup is straightforward:
- Make your changes in
elasticsearch.ymlin your home directory. - Restart the container:
docker restart elasticsearch.yml
Be aware that restarting the container will cause downtime. For production clusters, plan configuration changes carefully and apply them during a maintenance window, especially if the setting you’re changing affects cluster behavior or node roles.
Stack Monitoring
Stack Monitoring lets you collect logs and metrics from Elastic products, most importantly your production Elasticsearch nodes, and also things like Kibana. At a minimum, you need monitoring data for the production Elasticsearch cluster. Once that’s in place, Kibana can show monitoring data for other products in the Stack Monitoring page.
The legacy Elasticsearch Monitoring plugin approach (enabled via xpack.monitoring.collection.enabled) was deprecated in 7.16.
These days, Elastic recommends using Elastic Agent or Metricbeat to collect and ship monitoring data to a monitoring cluster.
Next, we’ll deploy a single-node monitoring cluster and use Elastic Agent to monitor our production cluster.
Deploying Elasticsearch
- Connect to
my-elasticsearch-monitoringssh my-elasticsearch-node-monitoring - Install docker, set
vm.max_map_count, and prepare local directories for data persistency:# install docker sudo apt-get update sudo apt-get install -y ca-certificates curl sudo install -m 0755 -d /etc/apt/keyrings sudo curl -fsSL https://download.docker.com/linux/ubuntu/gpg -o /etc/apt/keyrings/docker.asc sudo chmod a+r /etc/apt/keyrings/docker.asc echo \ "deb [arch=$(dpkg --print-architecture) signed-by=/etc/apt/keyrings/docker.asc] https://download.docker.com/linux/ubuntu \ $(. /etc/os-release && echo "${UBUNTU_CODENAME:-$VERSION_CODENAME}") stable" | \ sudo tee /etc/apt/sources.list.d/docker.list > /dev/null sudo apt-get update sudo apt-get install -y docker-ce docker-ce-cli containerd.io docker-buildx-plugin docker-compose-plugin sudo usermod -aG docker ${USER} # Set `vm.max_map_count` to at least 262144 sudo sysctl -w vm.max_map_count=262144 echo "vm.max_map_count=262144" | sudo tee -a /etc/sysctl.conf # Prepare a local directory for storing data and logs through a bind-mount mkdir esdatadir && chmod g+rwx esdatadir && sudo chgrp 0 esdatadir mkdir eslogsdir && chmod g+rwx eslogsdir && sudo chgrp 0 eslogsdir - Create a custom
elasticsearch.ymlin your home directory:discovery.type: single-node xpack.security.enabled: true network.host: 0.0.0.0 - Run Elasticsearch container:
 sudo docker run -d \
     --restart always \
     --group-add 0 \
     --volume $HOME/esdatadir:/usr/share/elasticsearch/data \
     --volume $HOME/eslogsdir:/usr/share/elasticsearch/logs \
     --ulimit nofile=65535:65535 \
     --env "bootstrap.memory_lock=true" --ulimit memlock=-1:-1 \
     --publish-all \
     --network host \
     --volume $HOME/elasticsearch.yml:/usr/share/elasticsearch/config/elasticsearch.yml \
     --env TZ=Asia/Seoul \
     --env ELASTIC_PASSWORD=elasticpassword \
     --name elasticsearch \
     docker.elastic.co/elasticsearch/elasticsearch:8.19.7
--env TZ=Asia/Seoul: Sets the container timezone (adjust as needed).ELASTIC_PASSWORD: Replace it with a password for your monitoring Elasticsearch node.
- Verify:
curl -u elastic:elasticpassword "http://localhost:9200/_cat/nodes?v&s=name"Output
ip heap.percent ram.percent cpu load_1m load_5m load_15m node.role master name 10.0.2.1 22 97 44 0.92 0.31 0.11 cdfhilmrstw * ip-10-0-2-1- Note that the node is assigned every role as it must do everything.
Deploying Kibana
- Set a password for
kibana_systemuser:curl -s -X POST -u "elastic:elasticpassword" -H "Content-Type: application/json" http://localhost:9200/_security/user/kibana_system/_password -d "{\"password\":\"kibanapassword\"}"kibanapassword: Replace it with your password.
- Create custom
kibana.yml:server.host: "0.0.0.0" server.shutdownTimeout: "5s" elasticsearch.hosts: ["http://localhost:9200"] elasticsearch.username: "kibana_system" elasticsearch.password: "kibanapassword" xpack.encryptedSavedObjects.encryptionKey: "d7x9s2k5v8y4b3m6n1q0w7e2r5t8y9u1" # Replace this with your own key. You can generate one using `./kibana-encryption-keys generate`. server.name: kibanaelasticsearch.hosts: Usehttp://localhost:9200since Elasticsearch is running on the same machine.
- Run Kibana container:
sudo docker run -d \ --restart always \ --network host \ --env TZ=Asia/Seoul \ --volume $HOME/kibana.yml:/usr/share/kibana/config/kibana.yml \ --name kibana \ docker.elastic.co/kibana/kibana:8.19.7 -
Verify the deployment by opening Kibana (
http://10.0.2.1:5601in this case) in your browser: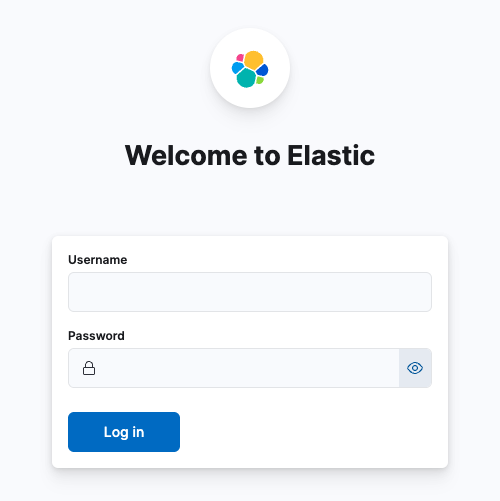
Installing Elasticsearch Integration
- Create a user on the production cluster that has the
remote_monitoring_collectorbuilt-in role.curl -X POST "http://localhost:9200/_security/user/elastic_agent?pretty" \ -u elastic:elasticpassword \ -H "Content-Type: application/json" \ -d '{ "password" : "changeme", "roles" : [ "remote_monitoring_collector"] }'elastic_agent: This is just a username for Elastic Agent. Feel free to use a different one.password: Choose a secure password for this user.
- Go to Kibana in your browser.
- Login with:
- Username:
elastic - Password: Your
ELASTIC_PASSWORD
- Username:
- Click
Add integrations. -
In the query bar, search for and select the
Elasticsearchintegration for Elastic Agent: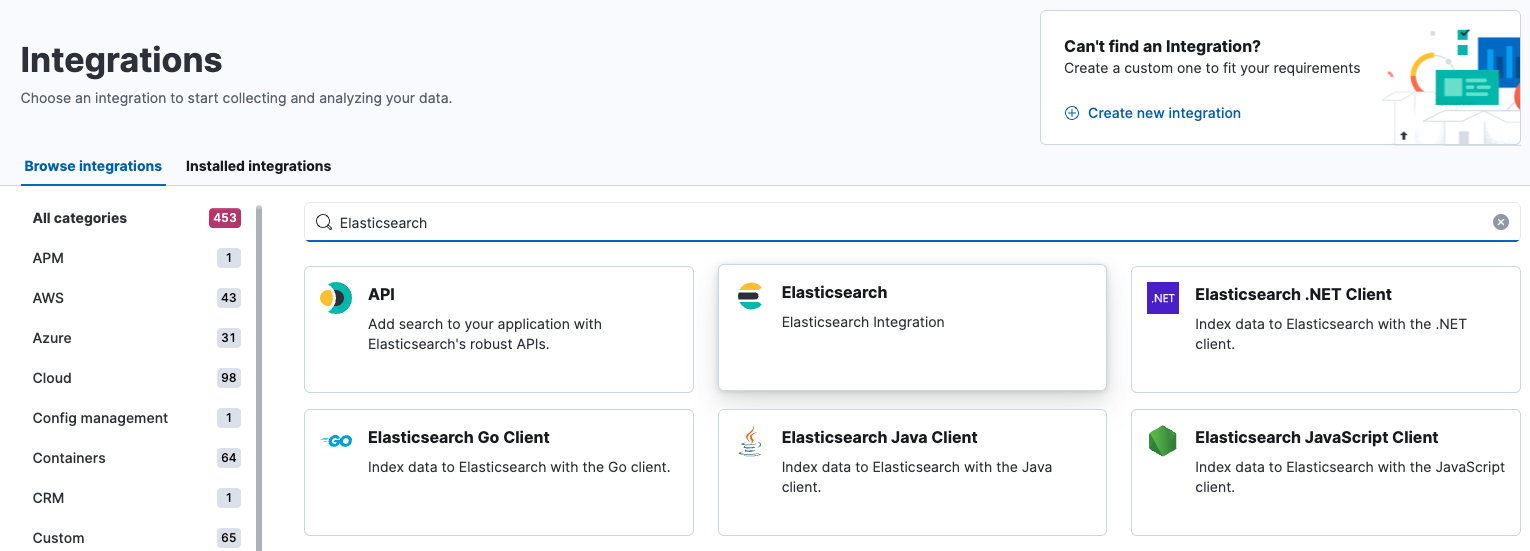
- Click
Add Elasticsearch. - Configure the integration name and optionally add a description. Make sure you configure all required settings:
- Go to Metrics (Stack monitoring) -> Change defaults:
- Hosts: Specify data nodes, or a load balancer that routes to master-ineligible nodes:
http://10.0.1.1:9200http://10.0.1.2:9200http://10.0.1.3:9200
- Advanced options:
- Username:
elastic_agent - Password:
changeme - Scope:
cluster(If set tonode, Elastic Agent only collects metrics from the specified hosts.)
- Username:
- Hosts: Specify data nodes, or a load balancer that routes to master-ineligible nodes:
- Go to Metrics (Stack monitoring) -> Change defaults:
- Click
Save and continue. This may take a minute or two. When it finishes, an agent policy with the Elasticsearch monitoring integration will be created. - Click
Add Elastic Agent later.
Deploying Elastic Agent
There are two ways to run Elastic Agent:
- Fleet-managed: Elastic Agent is centrally managed through Fleet in Kibana.
- Standalone: Elastic Agent is configured locally using YAML files.
In this tutorial, we’ll use the standalone approach to avoid the extra dependency on Fleet.
- Go to Kibana for the monitoring cluster in your browser.
- Go to
Fleet->Agents->Add Agent->Run standalone - Select
Agent Policy 1. - Click
Create API keyto generate an API key for Elastic Agent.- By default, the output host is set to
http://localhost:9200, which is where Elastic Agent will send monitoring data.
- By default, the output host is set to
- Click
Copy to clipboardorDownload policy - Connect to monitoring node:
ssh my-elasticsearch-node-monitoring - Create an
elastic-agent.ymlfile and paste the configuration from the clipboard, or copy the downloaded policy from step 5. - Run Elastic Agent container:
 docker run \
     -d \
     --restart always \
     --name elastic-agent \
     --network host \
     --user root \
     --volume $HOME/elastic-agent.yml:/usr/share/elastic-agent/elastic-agent.yml \
     docker.elastic.co/beats/elastic-agent:8.19.7
--network host: Allows the agent to connect to Elasticsearch viahttp://localhost:9200.- Startup usually takes a few seconds.
- Go to Kibana for the monitoring cluster in your browser.
- Click
Stack Monitoringin the left menu, then selectRemind me laterwhen prompted.
Once everything is set up successfully, Elastic Agent will start collecting and shipping monitoring data from the production Elasticsearch cluster. With this data in place, Kibana can display monitoring information for Elasticsearch and other Elastic Stack components:
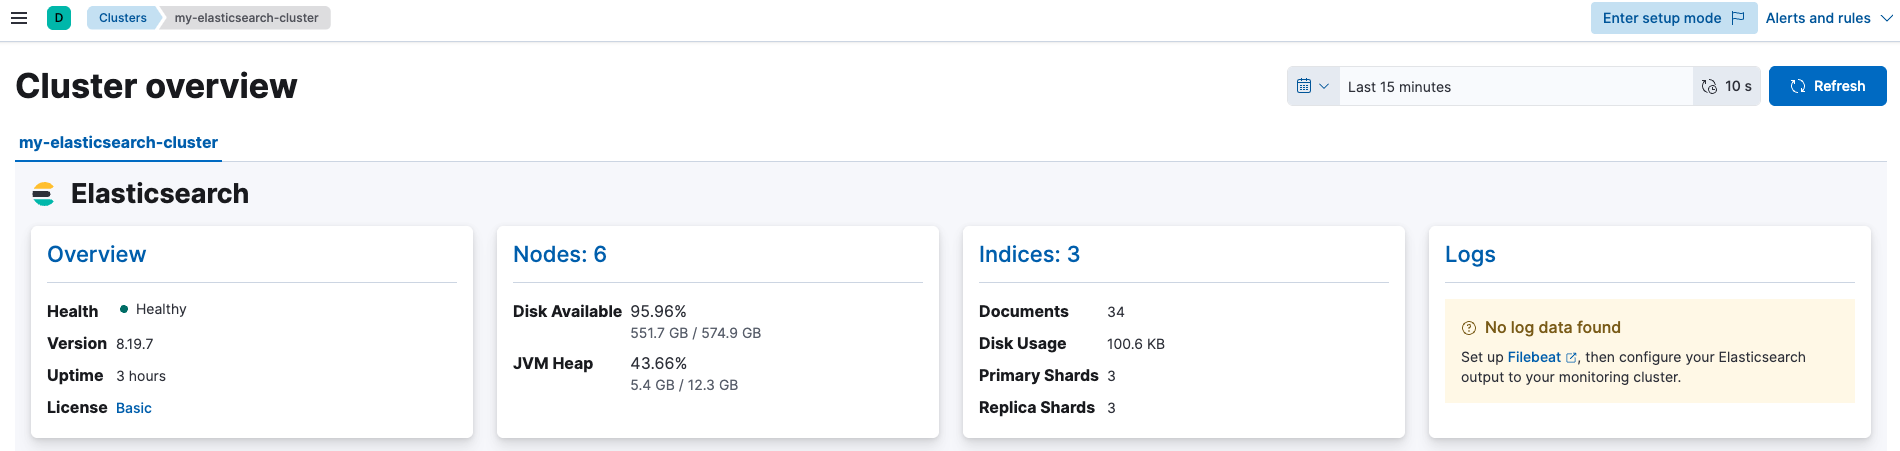
Click Nodes for node monitoring:

Click specific node for detailed metrics:
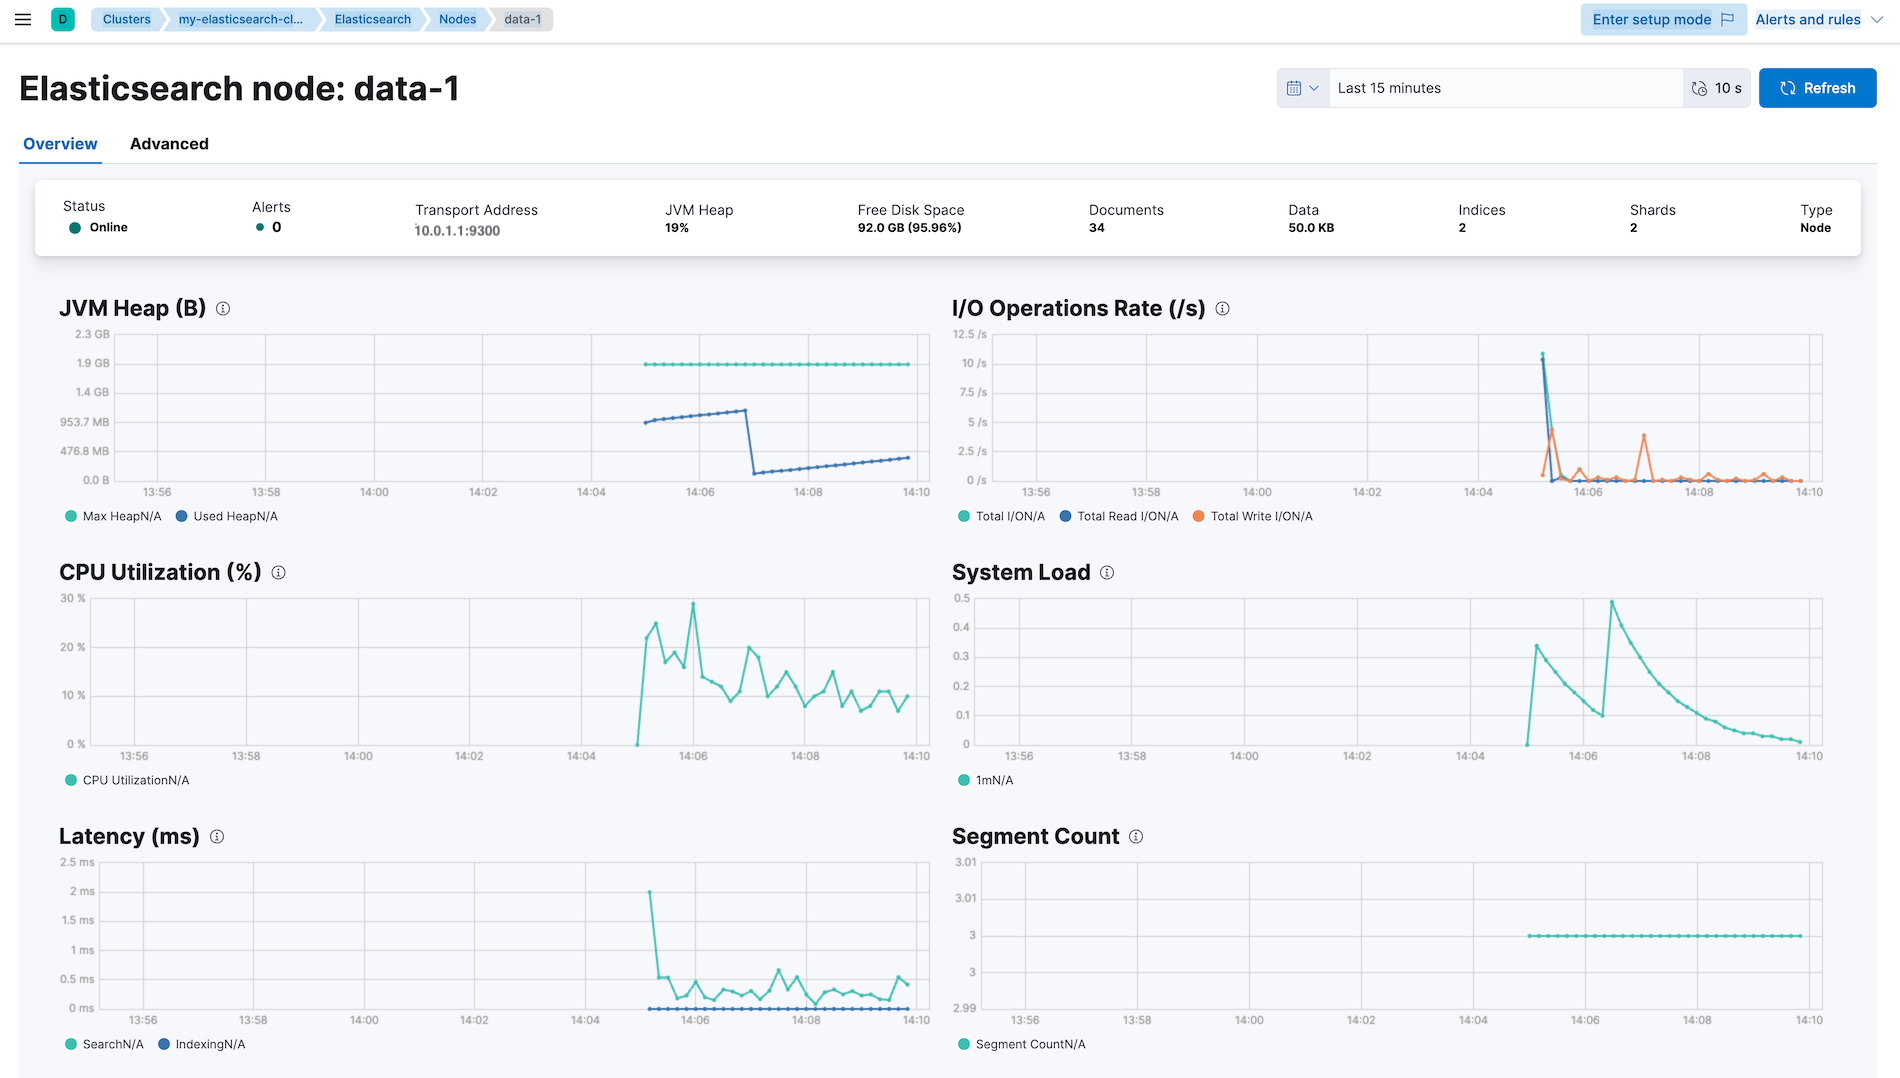
So far, Elastic Agent runs on the same node as the monitoring Elasticsearch and Kibana, but it can be deployed on any other node as well.
To do that, update the Outputs in the agent policy:
- Go to
Fleet->Settings->Outputs->Add output - Set the monitoring Elasticsearch host to
http://10.0.2.1:9200.
Updating the output will result in an elastic-agent.yml similar to the following:
...
outputs:
  default:
    type: elasticsearch
    hosts:
      - http://10.0.2.1:9200
...
When new nodes are added to the production cluster, Elastic Agent will automatically start collecting their metrics without requiring any output changes.
In practice, however, it’s advisable to place a load-balancing proxy in front of master-ineligible nodes. This distributes monitoring traffic evenly and prevents overloading master nodes, which must remain stable.
Creating a Load Balancer
Below is an example of setting up a load balancer with a TLS listener that forwards traffic only to master-ineligible data nodes in your Elasticsearch cluster:
- Create a target group:
- Target type:
Instances - Target group name:
my-elasticsearch - Protocol:
TCP - Port:
9200 - Health check protocol:
TCP - Health check port:
Trafic port(9200 in this case) - Targets:
my-elasticsearch-node-data-1my-elasticsearch-node-data-2my-elasticsearch-node-data-3
- Target type:
- Create a networkd load balancer. This is a good choice for Elasticsearch because it has low latency and works well with TCP/TLS passthrough:
- Load balancer name:
my-elasticsearch - Scheme:
Internal(recommended for private networks) - VPC: (Use the same VPC as your Elasticsearch nodes)
- Security group: (Allow inbound traffic on TCP 443 from trusted sources)
- Listeners:
- Protocol:
TLS - Port:
443 - Target group:
my-elasticsearch - Default SSL/TLS server certificate: (Your ACM or imported certificate)
- Protocol:
- With this setup, clients connect over HTTPS on port 443, and the NLB forwards traffic directly to port 9200 on the data nodes.
- Load balancer name:
- Create a DNS record (for example, in Route 53):
- Use the hostname covered by your TLS certificate
- Route to the network load balancer
After this, clients can reach Elasticsearch using a simple HTTPS URL. You can use this URL as the Elasticsearch hosts for Elastic Agent instead of listing the IP addresses of individual data nodes. When you add or remove data nodes, the only thing you need to update is the target group. The client configuration stays the same, and the load balancer automatically handles routing traffic to the available data nodes.
Shell Scripts for Easier Deployment
Often, we need to scale out the cluster to handle more traffic. Manually repeating every step in this guide is daunting.
To make life easier, here are complete scripts you can use:
- For initializing a fresh Elasticsearch cluster:
init_cluster.sh - For joining nodes to an exisiting Elasticsearch cluster:
join_cluster.sh - For initializing a single-node monitoring cluster:
init_monitoring_stack.sh
Before running them, make sure you update these values to match your environment:
VERSIONTimezoneELASTIC_PASSWORDca.crtandca.keyfiles (refer toREPLACE ITin thejoin_cluster.shfile)
Conclusion
Running a self-managed cluster means you own everything. You operate it, you watch it, and you fix it when it breaks. Scaling, monitoring, and compliance are all on you. That work costs time and money, and there’s no way around that.
The upside is what you don’t have. No extra control planes, no operators, no Kubernetes glue code deciding things on your behalf. Systems like ECK (Elastic Cloud on Kubernetes) add layers, and layers add complexity. Complexity creates edge cases, and edge cases could fail in unexpected ways.
If your environment can handle the operational load and you care about clarity, predictability, and knowing exactly how your system behaves, a self-managed cluster can be a good choice.