
Centralized Logging for Kubernetes Applications with EFbK Stack (Demonstration with FastAPI)
In software development, logging is the act of recording events and messages generated by an application. It plays a crucial role in observability, enabling developers and system administrators to monitor application behavior, debug issues, and optimize performance effectively.
About events and messages, events represent a fact that something happened at a specific time. Messages serve a broader role, encompassing both events and documents which can contain any verbose debugging information.
Logging Challenges in Clustered Environments
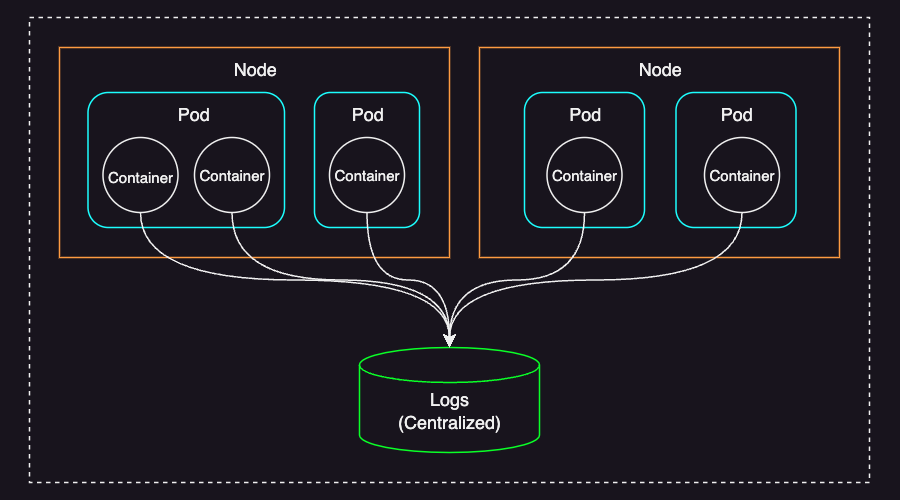
In a clustered environment like Kubernetes, where multiple applications run across distributed nodes, log management becomes significantly more complex due to several challenges:
- Ephemeral nature of containers: When a pod is terminated or evicted, its logs disappear unless explicitly stored elsewhere.
- Logs are distributed across multiple nodes: As each node maintains its own local logs, searching through them manually from different nodes is inefficient and impractical.
- Scalability challenges: A large-scale Kubernetes cluster generates an enormous volume of logs. Handling such volume can lead to performance bottlenecks and storage issues.
To address these challenges, Kubernetes applications require a centralized logging solution that collects logs from all nodes, aggregates them in a structured format (like JSON for example), and makes them searchable and analyzable in real-time.
The EFbK stack is a choice for achieving this.
EFbK Stack

The EFbK stack is a centralized logging solution for aggregating, forwarding, and analyzing logs from multiple applications running in a Kubernetes environment.
EFbK stands for:
- E = Elasticsearch: A scalable, distributed search and analytics engine used for storing and indexing logs.
- Fb = Fluent Bit: A lightweight log processor and forwarder that collects logs from Kubernetes containers and routes them to destinations like Elasticsearch.
- K = Kibana: A visualization tool that provides a UI for querying, analyzing, and monitoring logs stored in Elasticsearch.
Why Fluent Bit? (A Comparison with Other Log Processors)
For centralized logging in Kubernetes, several alternatives exist, with the most common being the ELK and EFK stacks. The key difference between these stacks lies in the log processor—Logstash or Fluentd. While both are powerful, I chose Fluent Bit over these alternatives for the following reasons:
- Simplicity: Fluent Bit is purpose-built for log collection and forwarding, making it ideal for straightforward use cases. Its lightweight design minimizes deployment and configuration complexity.
- Efficient resource utilization: Fluent Bit consumes significantly fewer CPU and memory resources compared to Logstash and Fluentd, making it a great choice for resource-constrained environments or even large-scale clusters.
- Scalability without overhead: Its low resource footprint allows it to scale efficiently without negatively impacting overall cluster performance.
Below is a comparison of the three log processors:
| Logstash | Fluentd | Fluent Bit | |
|---|---|---|---|
| Language | JRuby | C & Ruby | C |
| Memory | Greater than 120MB | Greater than 60MB | Approximately 1MB |
| Performance | Low to medium | Medium | High |
| Plugins | Many plugins, strong with Elasticsearch | Over 1,000 external plugins | Over 100 built-in plugins |
| Best For | Heavy log processing & transformation | Flexible log processing & forwarding | Lightweight log forwarding |
Filebeat is another lightweight log shipper. While Filebeat is an excellent choice for simple file-based log collection, Fluent Bit is CNCF-maintained, making it a better fit for Kubernetes environments. Fluent Bit also offers more flexibility with built-in filtering, parsing, and buffering mechanisms that Filebeat lacks.
Prerequisites
This tutorial assumes that you have an operational Kubernetes cluster, along with Elasticsearch and Kibana already set up. We will install and configure Fluent Bit later in this guide.
If you don’t have Elasticsearch and Kibana installed, there are several deployment options available:
- Elastic Cloud – A managed solution provided by Elastic (requires a subscription).
- Self-hosted deployment – Install Elasticsearch and Kibana on your own dedicated servers.
- Kubernetes deployment – Use Elastic Cloud on Kubernetes (ECK) to deploy them within your cluster.
For those who need a quick test setup, I have provided minimal Kubernetes manifests to deploy Elasticsearch and Kibana in your cluster. This setup includes:
- A single-node Elasticsearch instance running within Kubernetes.
- A Kibana dashboard exposed externally via a
LoadBalancerservice. - An internal
ClusterIPservice for Elasticsearch (not directly exposed). - Security features enabled, with credentials configured at deployment time.
To deploy, download the elastic.yaml file and run the following command:
kubectl apply -f elastic.yaml
Once applied, the deployment may take a few minutes to complete.
For production use, I strongly recommend setting up a multi-node Elasticsearch cluster for better availability and provisioning persistent storage to safely retain log data.
The versions used in this guide are:
- Kubernetes 1.30
- Elasticsearch 8.13.4
- Fluent Bit 3.2.2
- Kibana 8.13.4
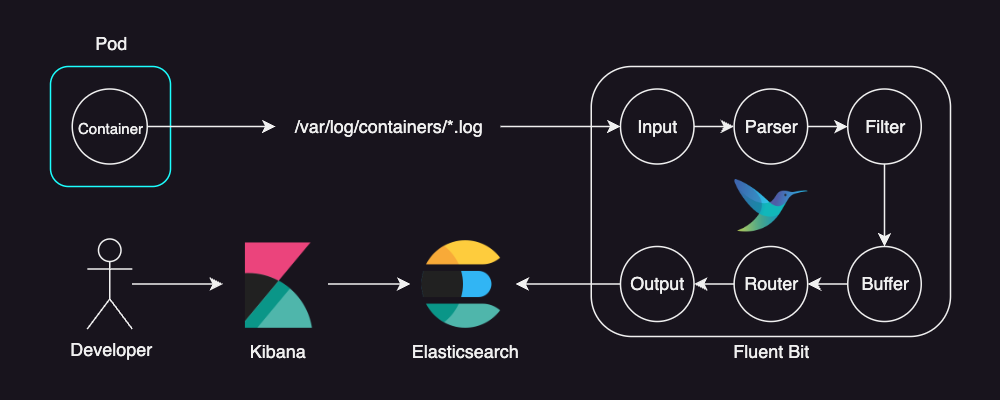
Below is an overview of the workflow for storing container logs in Elasticsearch and analyzing them using Kibana:
Application for Demonstration (FastAPI)
For this demonstration, we will deploy a simple web application using FastAPI, a popular web framework in Python. The application simulates an e-commerce service and provides two API endpoints:
/search– Allows users to search for items./items/{item_id}– Retrieves details of a specific item.
To make logging more informative, the application utilizes a middleware that logs incoming HTTP requests along with relevant metadata, such as:
- HTTP method (e.g., GET, POST)
- URL of the request
- Response status code
- Elapsed time (request duration)
- Timestamp
Additionally, the application introduces variable processing times to simulate real-world execution delays, ensuring the logged elapsed times reflect different request durations.
Here’s the application code:
# app.py

import asyncio
import json
import logging
import random
import time
from datetime import datetime

from fastapi import FastAPI, Request, Response

# Configure logging to print only the message for more flexible log structure
logging.basicConfig(level=logging.INFO, format="%(message)s")

# Disable uvicorn access logs to delegate HTTP logs to the logging middleware
logging.getLogger("uvicorn.access").setLevel(logging.WARNING)

logger = logging.getLogger(__name__)

app = FastAPI()


@app.middleware("http")
async def log_http_request_and_elapsed_time(request: Request, call_next) -> Response:
    start_time = time.perf_counter()
    response = await call_next(request)
    elapsed_time = time.perf_counter() - start_time
    log = {
        "method": request.method,
        "url": str(request.url),
        "status": response.status_code,
        "elapsed": round(elapsed_time, 3),
        "time": datetime.now().isoformat(),
    }
    logger.info(json.dumps(log))
    return response


@app.get("/search")
async def search(query: str):
    await asyncio.sleep(random.uniform(0.1, 0.3))  # Simulate a slow search process
    return {"query": query}


@app.get("/items/{item_id}")
async def read_item(item_id: int):
    await asyncio.sleep(random.uniform(0.2, 0.4))  # Simulate a slow read process
    return {"id": item_id}
When requests are processed, logs are generated in structured JSON format, making them easily parsable by logging systems like Elasticsearch. JSON-based logs are beneficial because they:
- are machine-readable and can be easily indexed by Elasticsearch.
- provide consistent formatting for efficient log analysis.
- allow powerful querying and filtering in Kibana.
To generate traffic for our application, we use a script that simulates requests to the API endpoints:
# generate_requests.py

import random
import string

import requests


def main():
    """
    Simulate HTTP requests to the web app endpoints.
    """
    BASE_URL = "http://localhost:8000"
    while True:
        # Choose an endpoint based on weighted probabilities.
        endpoint = random.choices(["search", "items"], weights=[3, 7], k=1)[0]
        if endpoint == "search":
            # Generate a random gibberish string just to simulate different search queries.
            query = "".join(random.choices(string.ascii_lowercase, k=4))
            url = f"{BASE_URL}/search?query={query}"
            response = requests.get(url)
            print(f"[SEARCH] GET {url} -> {response.status_code}")
        elif endpoint == "items":
            # Choose an item_id between 1 and 5 based on weighted probabilities.
            item_id = random.choices(population=range(1, 6), weights=[1, 2, 4, 8, 16], k=1)[0]
            url = f"{BASE_URL}/items/{item_id}"
            response = requests.get(url)
            print(f"[ITEMS] GET {url} -> {response.status_code}")


if __name__ == "__main__":
    main()
Build the image using the Dockerfile below, tag it as demo-image, and push it to your container registry:
FROM python:3.11.4-slim

WORKDIR /app
RUN pip install fastapi uvicorn[standard] requests
COPY . .
Assuming the image name is demo-image, below is a Kubernetes manifest to deploy the application:
# demo-app.yaml
apiVersion: v1
kind: Namespace
metadata:
  name: demo-namespace
---
apiVersion: v1
kind: Pod
metadata:
  namespace: demo-namespace
  name: demo-app
spec:
  containers:
    - name: app
      image: demo-image
      command: ["uvicorn", "app:app"]
    - name: generate-requests
      image: demo-image
      command: ["python", "generate_requests.py"]
Apply the manifest to deploy the application in your cluster:
kubectl apply -f demo-app.yaml
Once the application is successfully deployed, you can stream the logs using:
k -n demo-namespace logs -f demo-app -c app
With the application running inside the Kubernetes cluster, logs will be forwarded to Elasticsearch once Fluent Bit is installed and configured.
Fluent Bit
To understand Fluent Bit better, I recommend reading the Fluent Bit Key Concepts. This page covers essential concepts such as events (records), tags, matches, and more.
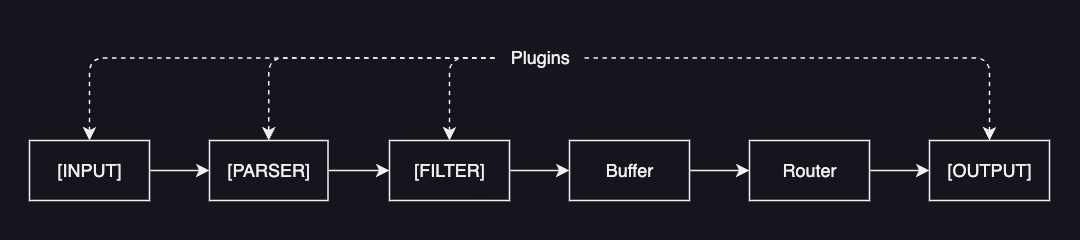
Fluent Bit collects and processes telemetry data through a structured data pipeline consisting of the following components:
- Input: gathers data from various sources (e.g. text files, system logs).
- Parser: converts unstructured messages into structured messages (e.g. JSON).
- Filter: modifies, enriches or drops records (e.g. adding Kubernetes metadata).
- Buffer: temporarily stores records in the system memory (heap) to handle backpressure and delivery failures.
- Router: routes logs through filters and forwards them to one or multiple destinations.
- Output: defines the final destinations for your logs. (e.g. Elasticsearch)
Each of these components is installed as a plugin. And each plugin is then created as an instance with its own independent configuration.
Plugin configurations are defined under the config mapping in a YAML-formatted file, as shown below:
config:
    inputs: |
        [INPUT]
            ...

    customParsers: |
        [PARSER]
            ...

    filters: |
        [FILTER]
            ...

    outputs: |
        [OUTPUT]
            ...
You can create multiple instances of each component. For example, multiple input plugins:
inputs: |
    [INPUT]
        ...

    [INPUT]
        ...
If you install Fluent Bit using Helm, it comes with default configurations for reading container and systemd logs and forwarding them to an Elasticsearch cluster. However, to tailor it to our environment and gain better flexibility, we will download the default values and modify them accordingly.
For a full list of available plugins for each phase, refer to the documentation linked above each section.
Input
We use the tail input plugin to read container logs from the Kubernetes nodes.
This plugin monitors log files and forwards log entries to the Fluent Bit pipeline.
Configuration:
## https://docs.fluentbit.io/manual/pipeline/inputs
inputs: |
    [INPUT]
        Name tail
        Path /var/log/containers/*.log
        multiline.parser docker, cri
        Tag kube.*
        Mem_Buf_Limit 5MB
        Skip_Long_Lines On
Properties:
Name: Specifies the input plugin to use.tailis used in this case.Path: Defines the location of log files. The wildcard (*.log) ensures that Fluent Bit reads all log files in/var/log/containersdirectory.multiline.parser: Specifies one or multiple parsers to apply to the content. For example, it will first trydocker, and then trycriifdockerdoes not match.Tag: Assigns a tag (kube.*) to logs for filtering and routing in later phases in the pipeline.Mem_Buf_Limit: Sets the limit of the buffer size per monitored file.Skip_Long_Lines: When it’sOn, Fluent Bit skips long lines that exceed the buffer limit (Buffer_Max_Size) instead of stopping monitoring.
What’s important here is Tag:
Every event ingested by Fluent Bit is assigned a Tag. This tag is an internal string used in a later stage by the Router to decide which
FilterorOutputphase it must go through.
About Path, /var/log/containers contains logs of all running containers on the node.
Specifically, each container’s logs can be found in a file named:
/var/log/containers/<pod_name>_<namespace>_<container_id>.log
And by specifying kube.* for Tag, any event read from it is assigned a tag of:
kube.var.log.containers.<pod_name>_<namespace>_<container_id>.log
(Note that FLuent Bit replaces slashes (/) in the path with dots (.) through what’s called “tag expansion”.)
Parser
The parser converts unstructured data to structured data.
Configuration:
## https://docs.fluentbit.io/manual/pipeline/parsers
customParsers: |
    [PARSER]
        Name docker
        Format json
        Time_Keep On
        Time_Key time
        Time_Format %Y-%m-%dT%H:%M:%S.%L
Properties:
Name: Sets a unique name for the parser.Format: Specifies the format of the parser.jsonis used in this case, meaning logs are parsed as JSON objects.Time_Key: Specifies the name of a timestamp field.Time_Format: Specifies the format of the time field.
Since every container log already includes a timestamp field, we preserve this original timestamp by setting Time_Keep On.
The extracted timestamp will be used as the @timestamp field in Elasticsearch indices.
For log messages that are not formatted as JSON, regular expressions can be used to transform them into a structured format.
Filter
We use the kubernetes filter plugin to enrich log files with Kubernetes metadata, such as pod name, namespace, container name, and more.
Configuration:
## https://docs.fluentbit.io/manual/pipeline/filters
filters: |
    [FILTER]
        Name kubernetes
        Match kube.*
        Merge_Log On
        Keep_Log Off
        K8S-Logging.Parser On
        K8S-Logging.Exclude On
Properties:
Name: Specifies the filter plugin to use.kubernetesis used in this case.Match: Defines which logs this filter should apply to. The valuekube.*ensures that the filter processes logs tagged withkube.*, which corresponds to logs collected from Kubernetes containers.Merge_Log: When set toOn, it checks if thelogfield content is a JSON string map, if so, it append the map fields as part of the log structure.Keep_Log: When set toOff, thelogfield is removed from the incoming message once it has been successfully merged (Merge_Logmust be enabled as well).K8S-Logging.Parser: When set toOn, Fluent Bit allows Kubernetes Pods to suggest a pre-defined Parser.K8S-Logging.Exclude: When set toOn, Fluent Bit allows Kubernetes Pods to exclude their logs from the log processor.
In addition to the original log message, this filter enriches log records with Kubernetes metadata. Below is an example of an enriched log entry (some values are masked for simplicity):
{
    "kubernetes": {
        "pod_name": "demo-app",
        "namespace_name": "demo-namespace",
        "pod_id": "...",
        "labels": {
            "app.kubernetes.io/name": "demo-app"
        },
        "annotations": {
            ...
        },
        "host": "my-host",
        "pod_ip": "10.42.209.165",
        "container_name": "api",
        "docker_id": "...",
        "container_hash": "...",
        "container_image": "demo-app:latest"
    }
}
This additional metadata helps developers track logs back to specific Kubernetes resources, making it easier to find issues, and search logs more effectively in Kibana.
Output
We use the es output plugin to ingest logs into an Elasticsearch database.
Configuration:
## https://docs.fluentbit.io/manual/pipeline/outputs
outputs: |
    [OUTPUT]
        Name es
        Match kube.var.log.containers.demo-app_demo-namespace_api*.log
        Host elasticsearch.elastic.svc.cluster.local
        HTTP_User elastic
        HTTP_Passwd elasticpassword
        Logstash_Format On
        Logstash_Prefix demo-app
        Suppress_Type_Name On
Properties:
Name: Specifies the output plugin to use.esis used in this case.Match: Defines the tag pattern to filter logs for output. The patternkube.var.log.containers.demo-app_demo-namespace_api*.logensures that only logs from theapi*container ofdemo-apppods within thedemo-namespacenamespace are routed to Elasticsearch. The patternkube.var.log.containers.demo-app_demo-namespace_api*.logensures that only logs fromapi*containers running within thedemo-apppods in thedemo-namespacenamespace are sent to Elasticsearch.Host: Specifies the host of the target Elasticsearch. Here,elasticsearch.elastic.svc.cluster.localjust refers to the internal cluster DNS name of the Elasticsearch service.HTTP_User: Username for Elasticsearch.HTTP_Passwd`Password for Elasticsearch user.Logstash_Format: When set toOn, Fluent Bit enables Logstash format compatibility.Logstash_Prefix: Specifies the prefix used for index names. Setting this todemo-appresults in indices being named in the formatdemo-app-YYYY.MM.DD.Suppress_Type_Name: Must be set toOn, as Elasticsearch 8.0.0 and later no longer support mapping types.
In order to filter logs from pods of a deployment, you have to set Match to something like kube.var.log.containers.demo-api-*_demo-namespace_api*.log.
This is because pod names contain a dynamic suffix that is automatically generated by Kubernetes when creating pod replicas for a deployment.
When Logstash_Format is On, Fluent Bit appends a date suffix (-YYYY.MM.DD) to index names.
This time-based indices facilitate automated retention policies, ensuring efficient storage and deletion of old logs (which will be covered later in this tutorial).
When Logstash_Format is Off, Fluent Bit instead stores logs in an index specified by the Index property, which defaults to fluent-bit.
Installation
To deploy Fluent Bit in your Kubernetes cluster, we use Helm.
For a complete values.yaml configuration file, refer to this link: values.yaml.
With the configurations we’ve set up, install Fluent Bit using the following Helm command:
helm repo add fluent https://fluent.github.io/helm-charts
helm upgrade --install fluent-bit fluent/fluent-bit --values values.yaml
Expected output on successful installation:
Release "fluent-bit" does not exist. Installing it now.
NAME: fluent-bit
LAST DEPLOYED: Tue Feb 18 01:02:47 2025
NAMESPACE: default
STATUS: deployed
REVISION: 1
NOTES:
Get Fluent Bit build information by running these commands:

export POD_NAME=$(kubectl get pods --namespace default -l "app.kubernetes.io/name=fluent-bit,app.kubernetes.io/instance=fluent-bit" -o jsonpath="{.items[0].metadata.name}")
kubectl --namespace default port-forward $POD_NAME 2020:2020
curl http://127.0.0.1:2020
Once Fluent Bit is successfully installed and running, it will start collecting logs in your Kubernetes environment and forwarding them to Elasticsearch as configured.
Configuring ILM
With finite storage, it’s important to periodically delete old log documents to prevent storage exhaustion. You can use Index Lifecycle Management (ILM) to automate this process.
In this example, we will configure ILM to delete any index whose name starts with demo-app- once it is older than 7 days. The steps involved are:
- Create am ILM policy.
- Create an index template that applies this policy to matching indices.
The ILM policy defines the lifecycle phases for your indices.
Here, we set up a policy to delete indices that are older than 7 days.
Execute the following command in the Kibana Console (Go to the Management tab and choose Dev Tools):
// create policy
PUT _ilm/policy/demo-policy
{
  "policy": {
    "phases": {
      "delete": {
        "min_age": "7d",
        "actions": {
          "delete": {}
        }
      }
    }
  }
}
This command creates a policy named demo-policy that automatically deletes any index older than 7 days.
Next, create an index template that applies the demo-policy ILM policy to any index whose name begins with demo-app-.
Run the following command in the Kibana Console:
// create template
PUT _index_template/demo-template
{
  "index_patterns": ["demo-app-*"],
  "template": {
    "settings": {
      "index.lifecycle.name": "demo-policy"
    }
  }
}
With this template, any newly created index matching demo-app-* will automatically have the ILM policy applied.
Note that this template only affects indices created after the template is set up.
If you have pre-existing indices that match the pattern (for example, demo-app-2025.02.23), they will not automatically have the ILM policy applied.
To verify whether an index is managed by ILM, use the following command:
GET demo-app-*/_ilm/explain
Output:
{
  "indices": {
    "demo-app-2025.02.23": {
      "index": "demo-app-2025.02.23",
      "managed": false
    }
  }
}
The managed field indicates whether ILM is managing the index.
In this example, demo-app-2025.02.23 is not managed because it was created before the template was applied.
To manually apply the ILM policy to an existing index, run:
PUT demo-app-2025.02.23/_settings
{
  "index": {
    "lifecycle": {
      "name": "demo-policy"
    }
  }
}
After applying the policy, you can confirm the change by running the explain command again:
GET demo-app-*/_ilm/explain
Output:
{
  "indices": {
    "demo-app-2025.02.23": {
      "index": "demo-app-2025.02.23",
      "managed": true,
      "policy": "demo-policy",
      "index_creation_date_millis": 1739841343775,
      "time_since_index_creation": "4.54h",
      "lifecycle_date_millis": 1739841343775,
      "age": "4.54h",
      "phase": "new",
      "phase_time_millis": 1739857711731,
      "action": "complete",
      "action_time_millis": 1739857711731,
      "step": "complete",
      "step_time_millis": 1739857711731,
      "phase_execution": {
        "policy": "demo-policy",
        "version": 1,
        "modified_date_in_millis": 1739857599286
      }
    }
  }
}
Now that the managed field is true, the index demo-app-2025.02.23 is under ILM control and will be automatically deleted 7 days after its creation, as specified by the demo-policy.
ILM poll interval
By default, ILM checks for indices that meet policy criteria every 10 minutes. To permanently update the poll interval to 1 minute for example, run the following command in Kibana Console:
PUT /_cluster/settings
{
  "persistent": {
    "indices.lifecycle.poll_interval": "1m"
  }
}
This change will persist across cluster restarts.
If you prefer to change the setting only until the next restart, you can update the poll interval temporarily using:
PUT /_cluster/settings
{
  "transient": {
    "indices.lifecycle.poll_interval": "1m"
  }
}
After making these changes, verify that the setting has been applied by running:
GET /_cluster/settings
Output:
{
  "persistent": {},
  "transient": {
    "indices": {
      "lifecycle": {
        "poll_interval": "1m"
      }
    }
  }
}
Log Analytics
Once everything is set up and logs are flowing into Elasticsearch, we can analyze them using Kibana.
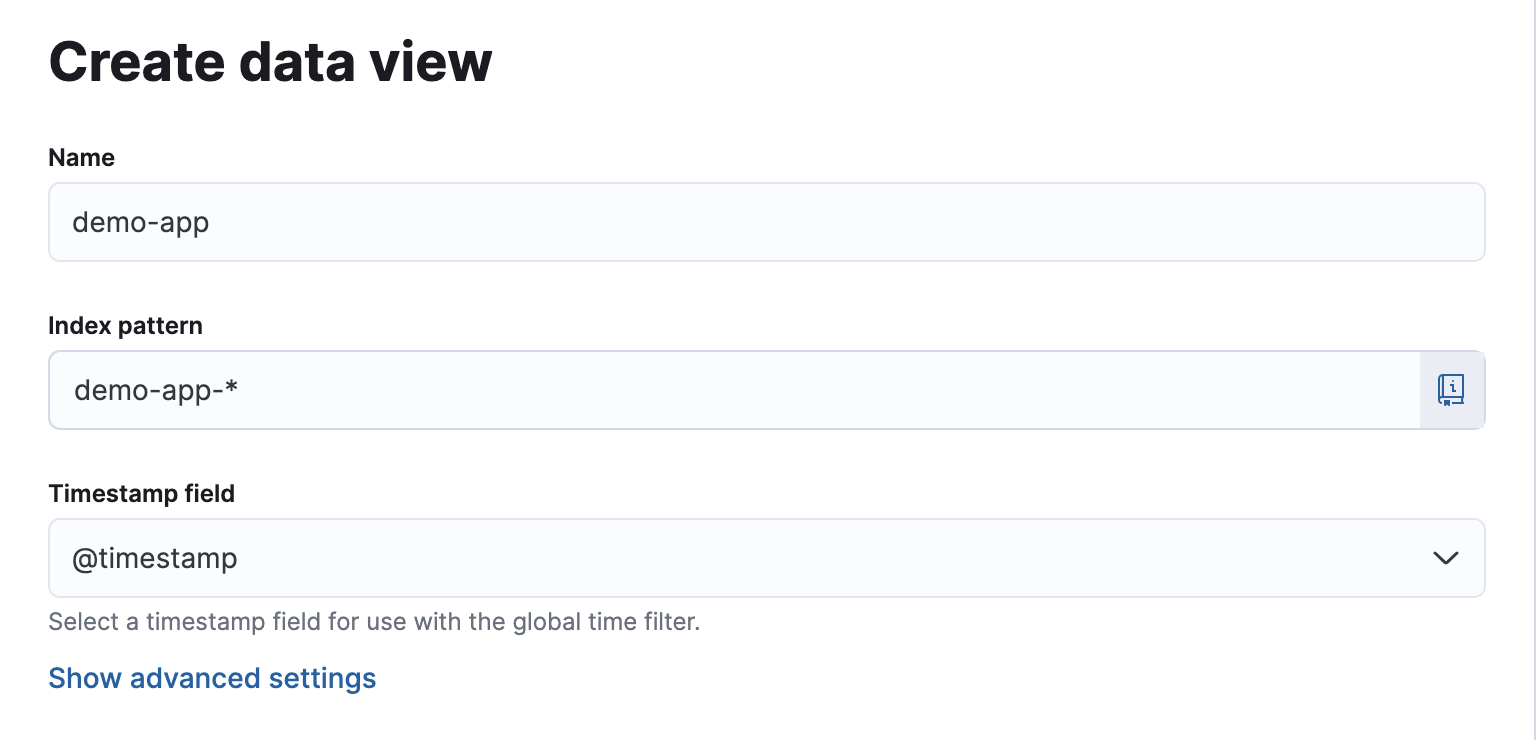
To start, open Kibana in your web browser, navigate to the Analytics menu, and create a data view for demo-app-*.
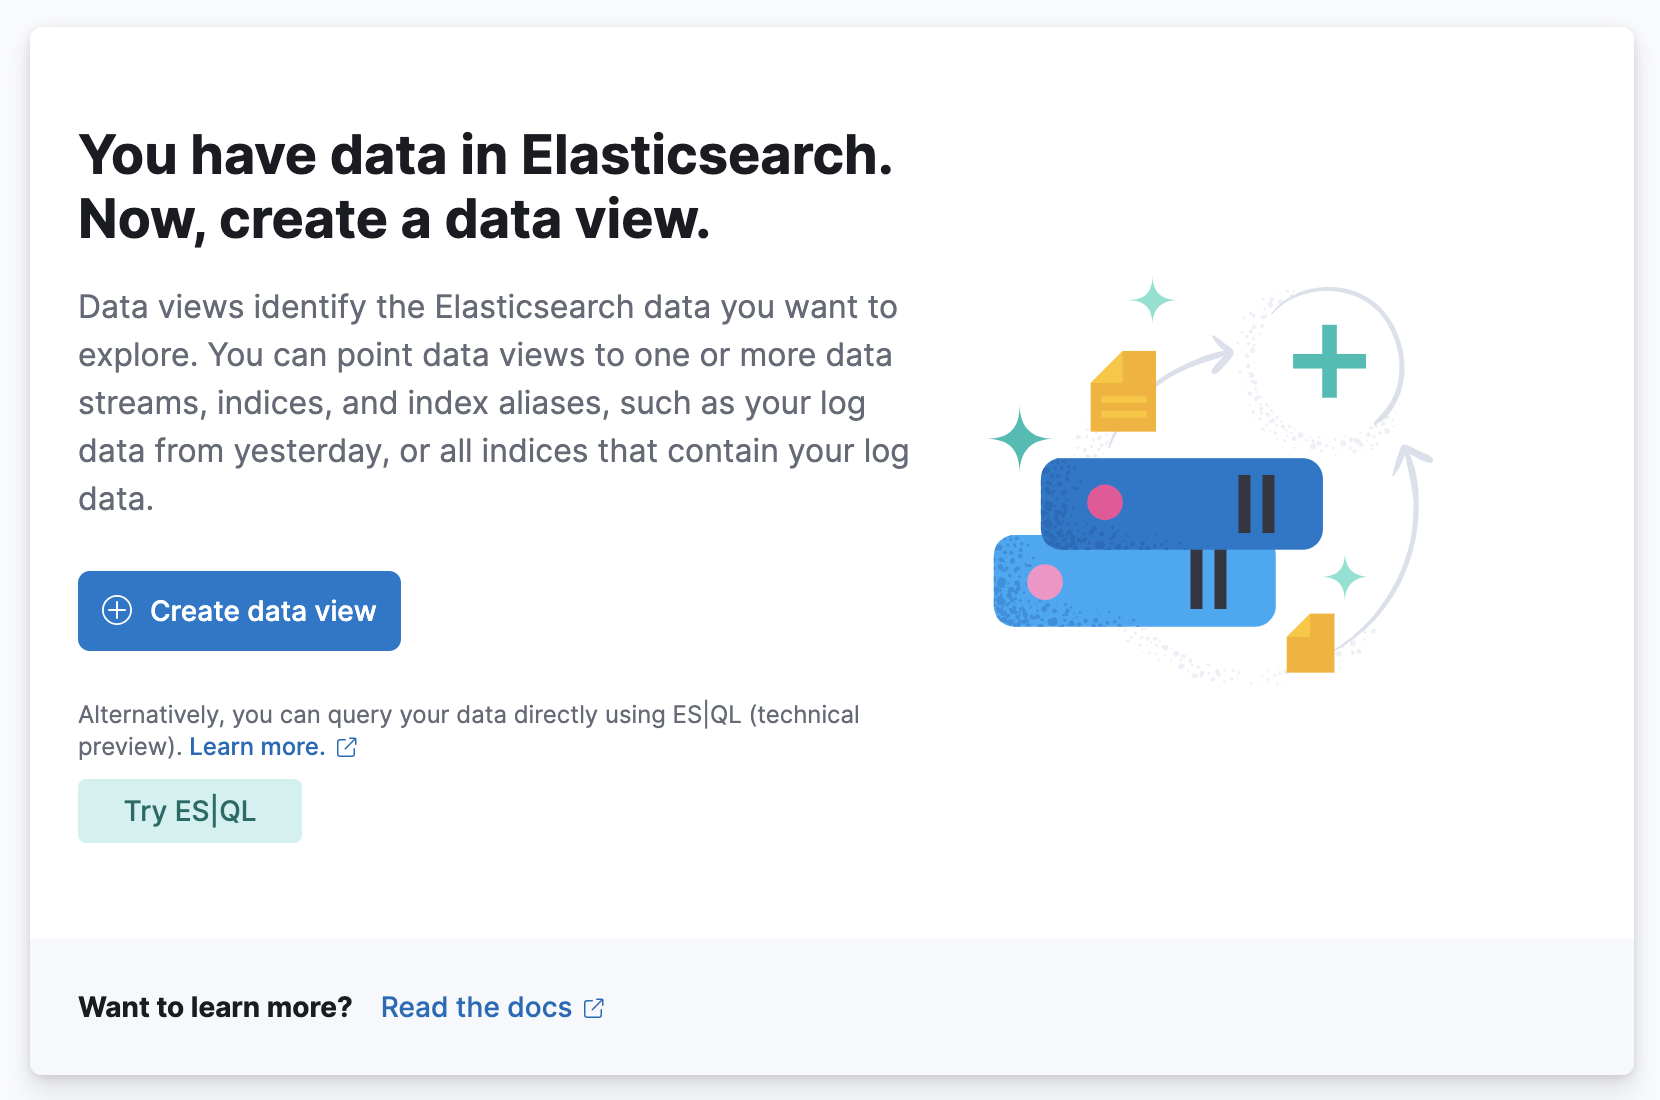
For the index pattern, enter demo-app-* to include all indices that match this prefix.
This allows Kibana to aggregate and visualize logs from all instances of the demo-app.
For basic log exploration, navigate to the Discover tab.
Here, you can view all collected logs in real time or filter them based on specific time ranges.
For example, to analyze logs between 2025-02-23T14:00:00 and 2025-02-23T15:00:00, select the appropriate time range using the time filter in Kibana:
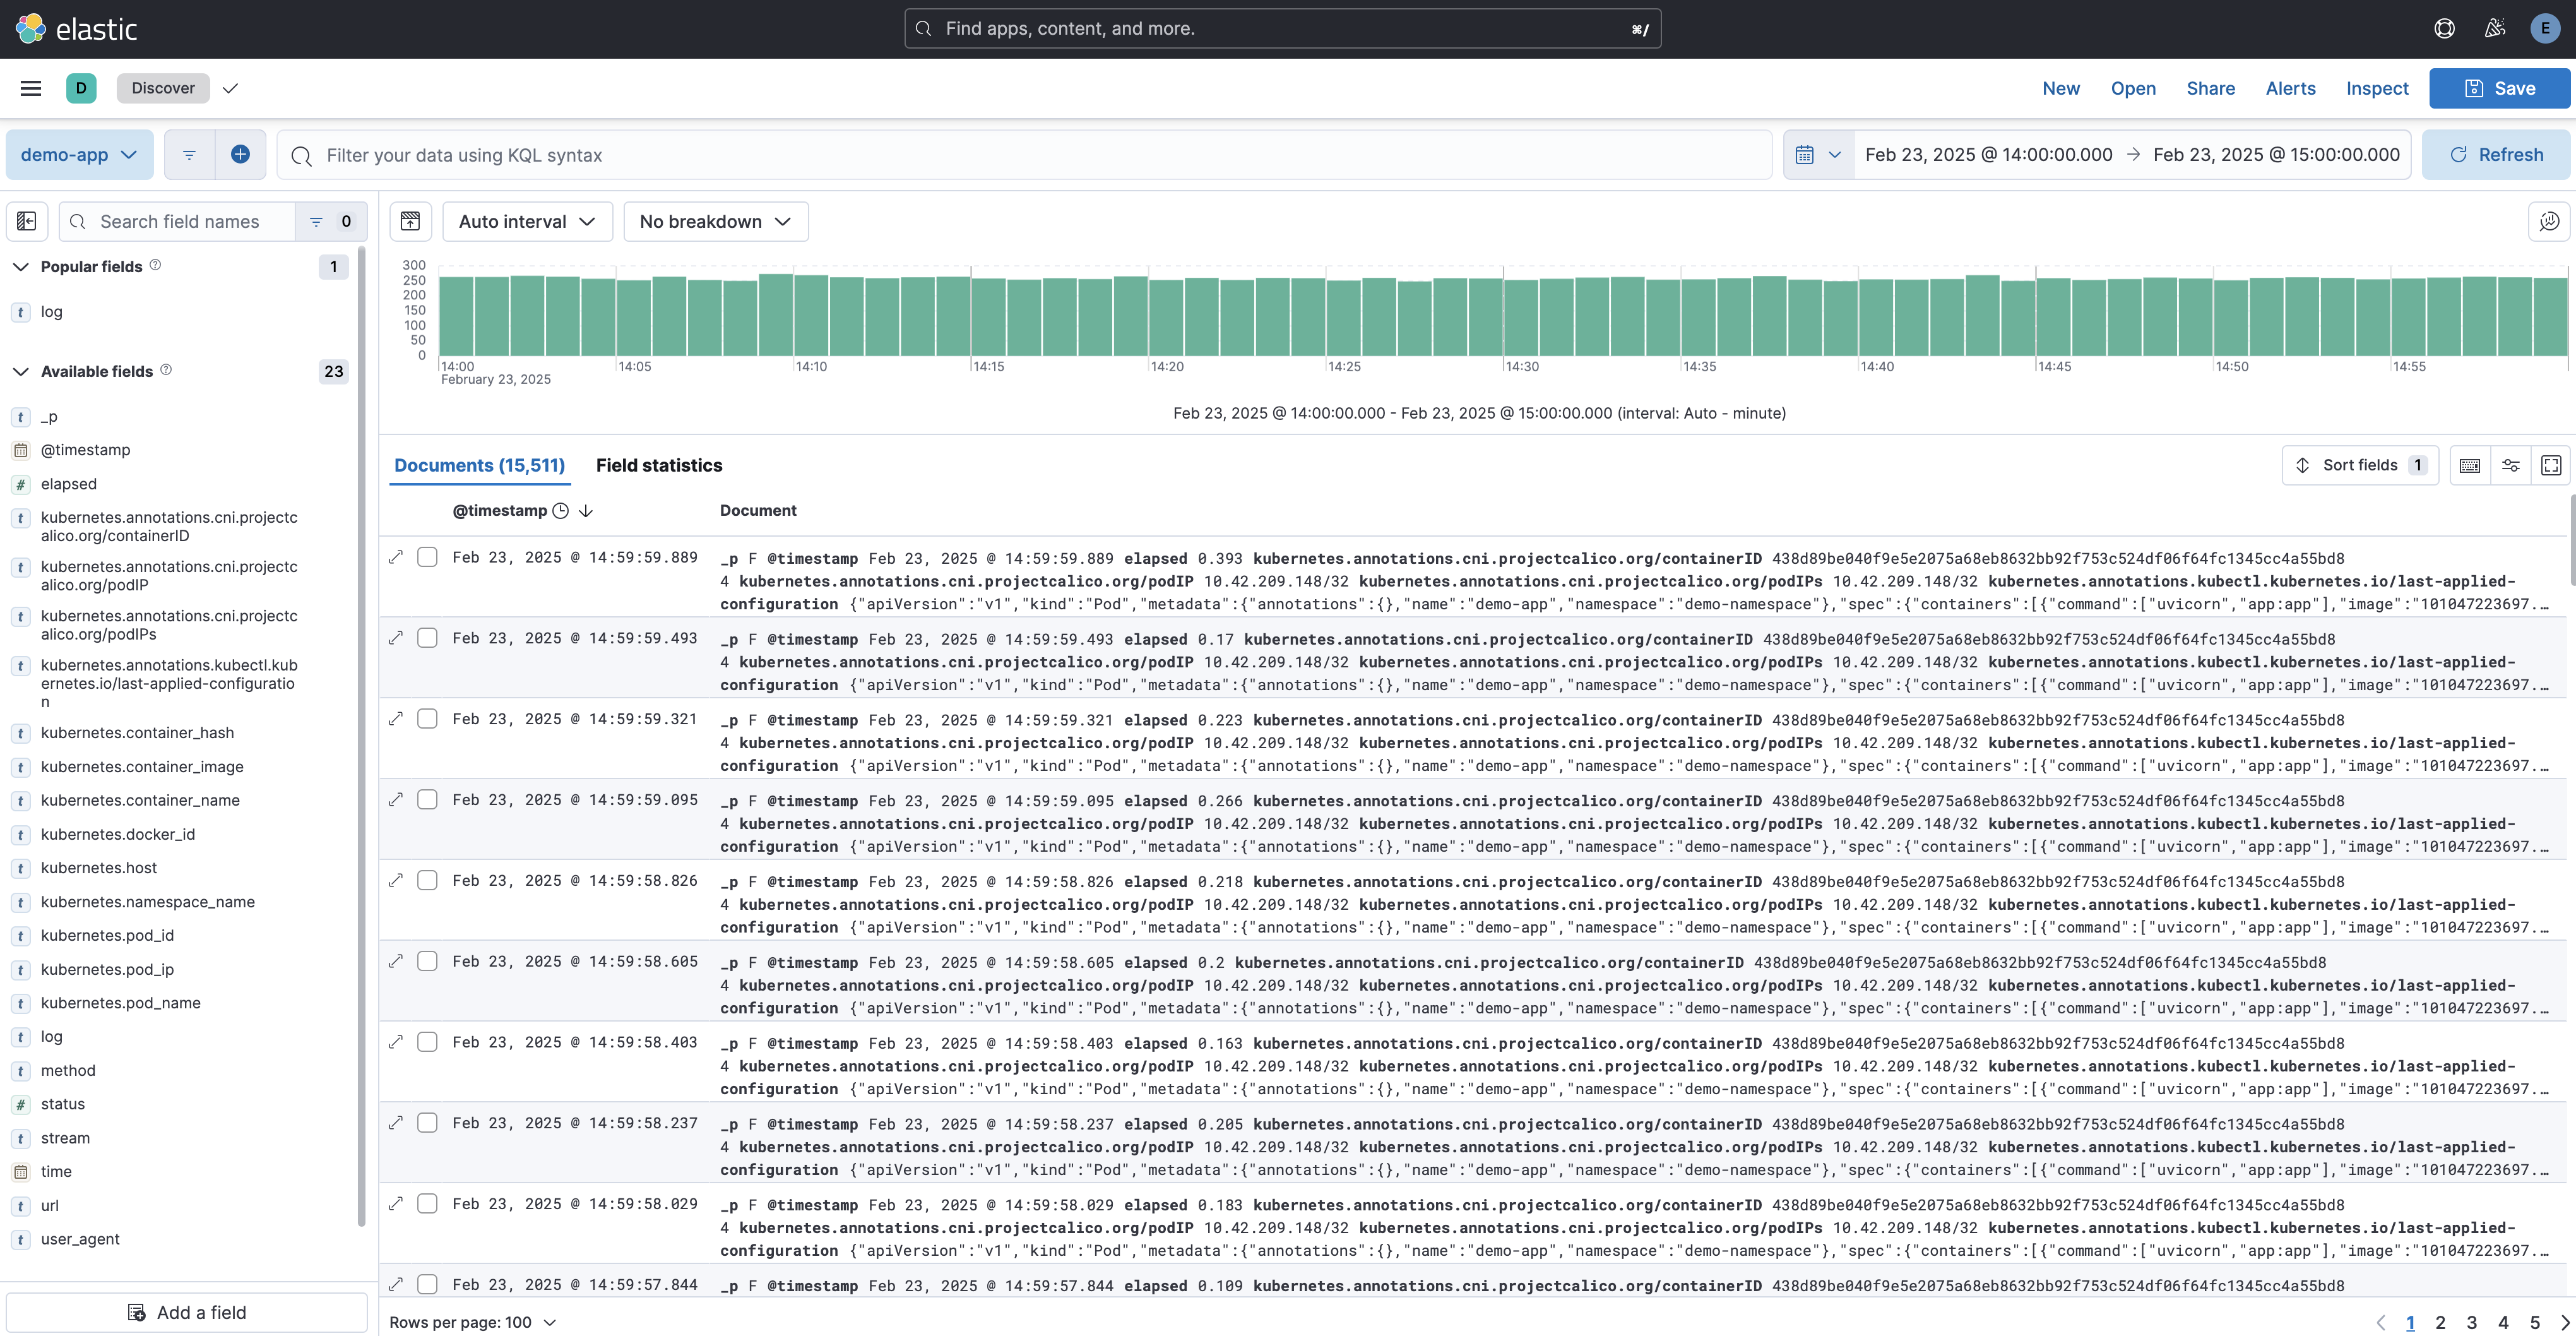
On this page, you can search, filter, and apply queries to analyze logs efficiently. Kibana supports Lucene Query Syntax, KQL (Kibana Query Language), and full-text search to help you quickly find relevant logs. You can also customize displayed fields, save searches, and export data for further analysis.
Below are some possible log analysis use cases for our scenario.
Monitoring Response Time
Understanding response times is crucial for tracking application performance. Kibana allows you to visualize response times over a given period to detect potential slowdowns.
To analyze response times for a specific API endpoint, /seach for example:
-
Add a filter for the
urlfield to match thesearchendpoint: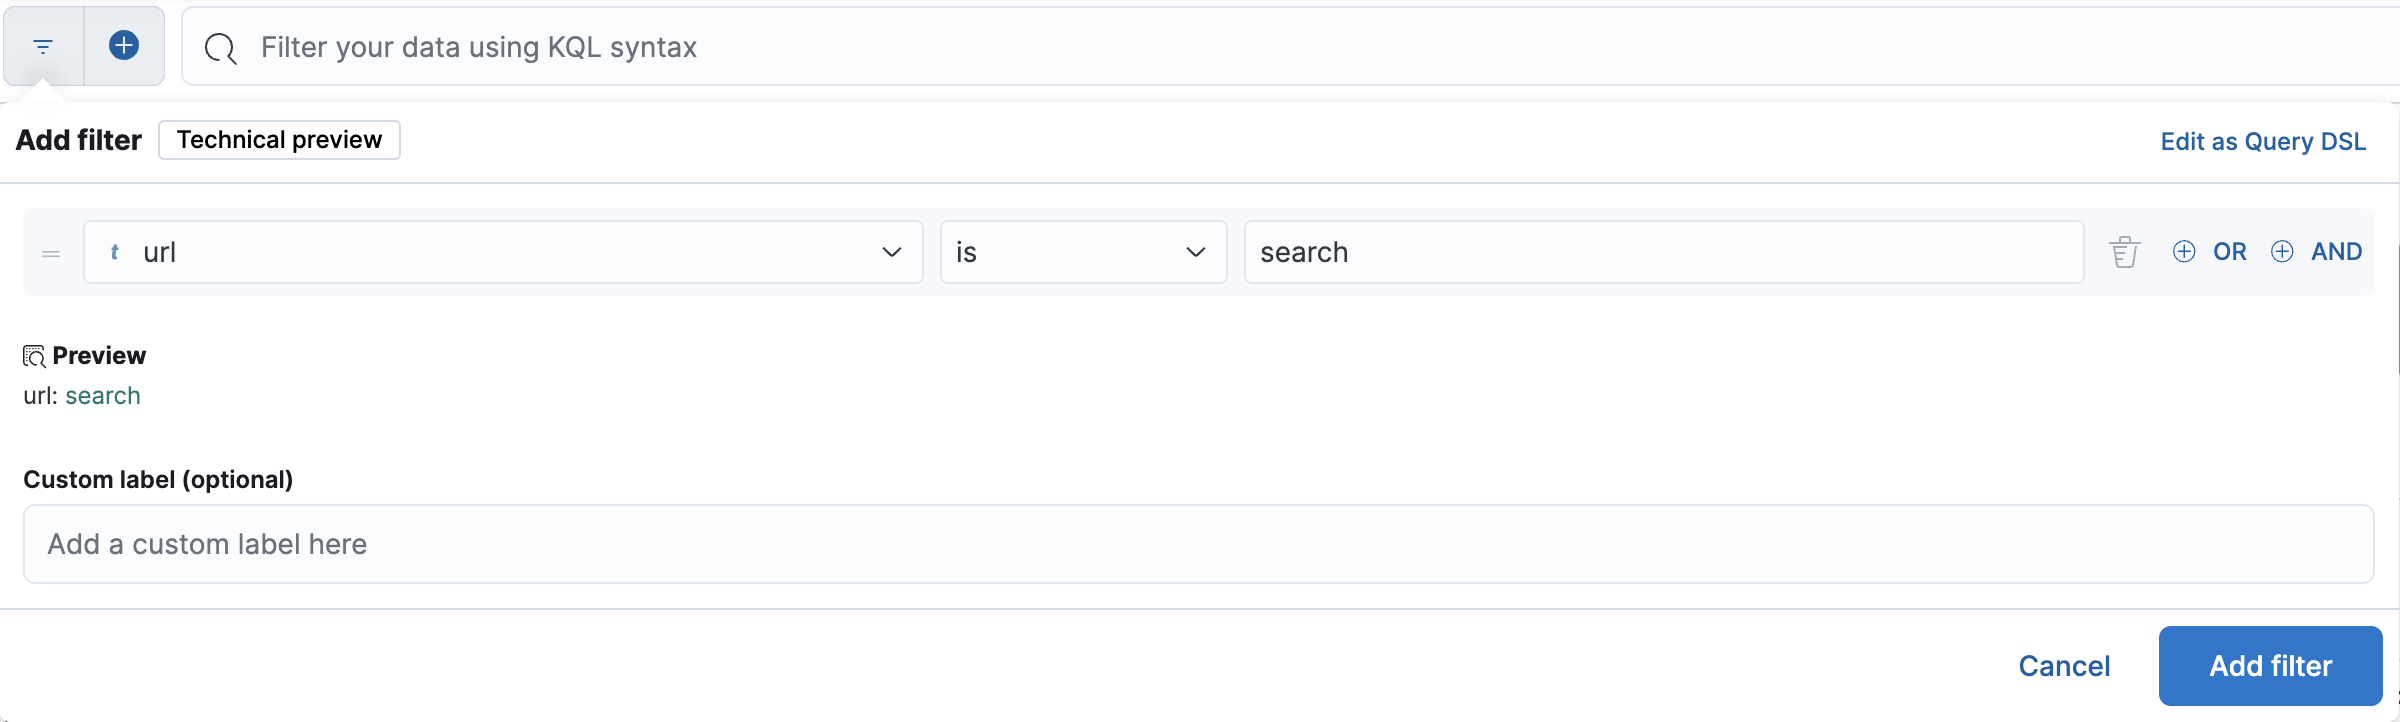
-
Select the
elapsedfield, which represents the request processing time: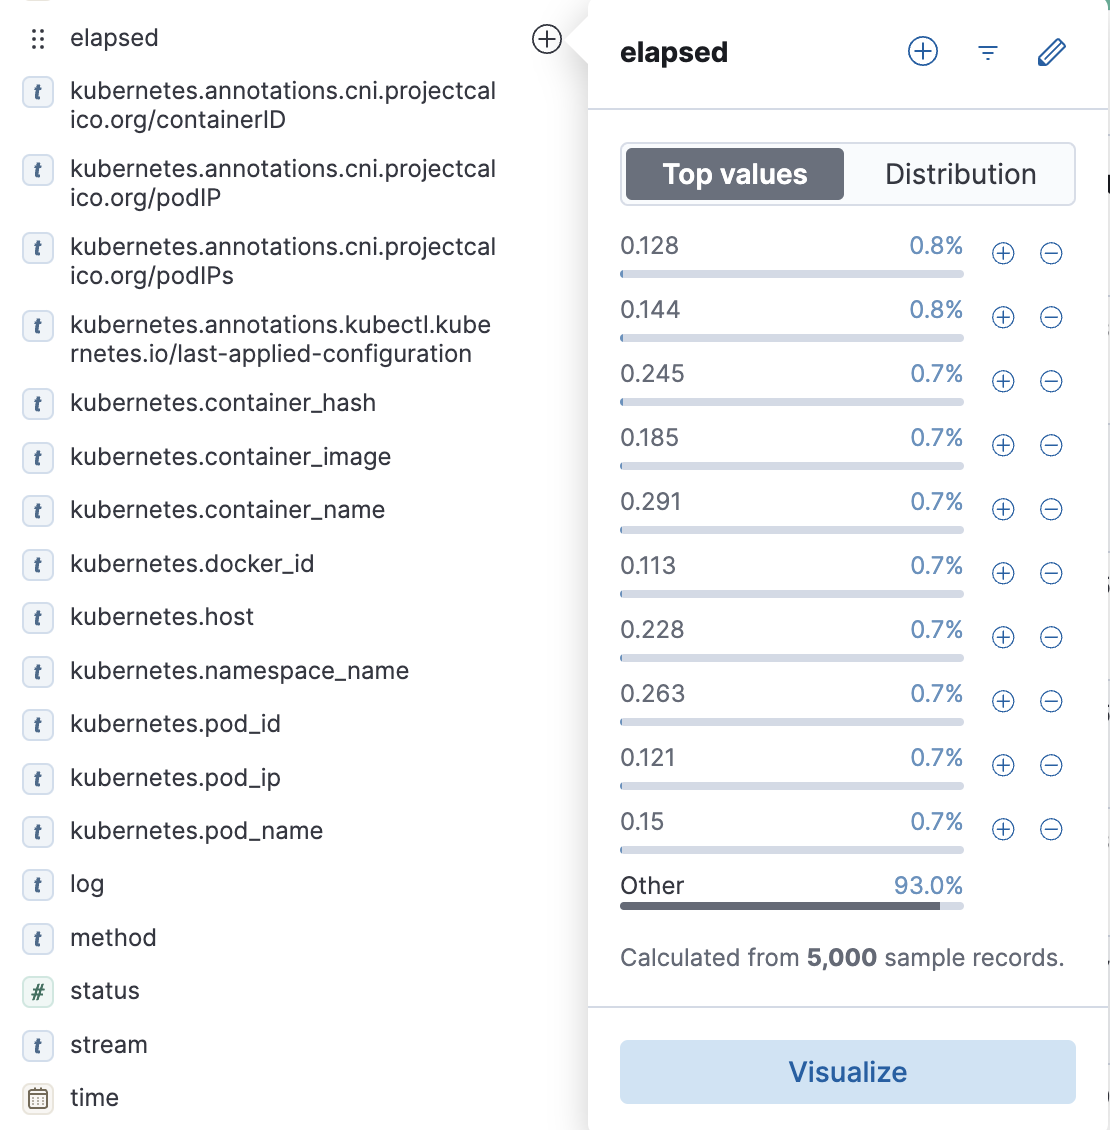
-
Choose
Visualizeto generate a chart: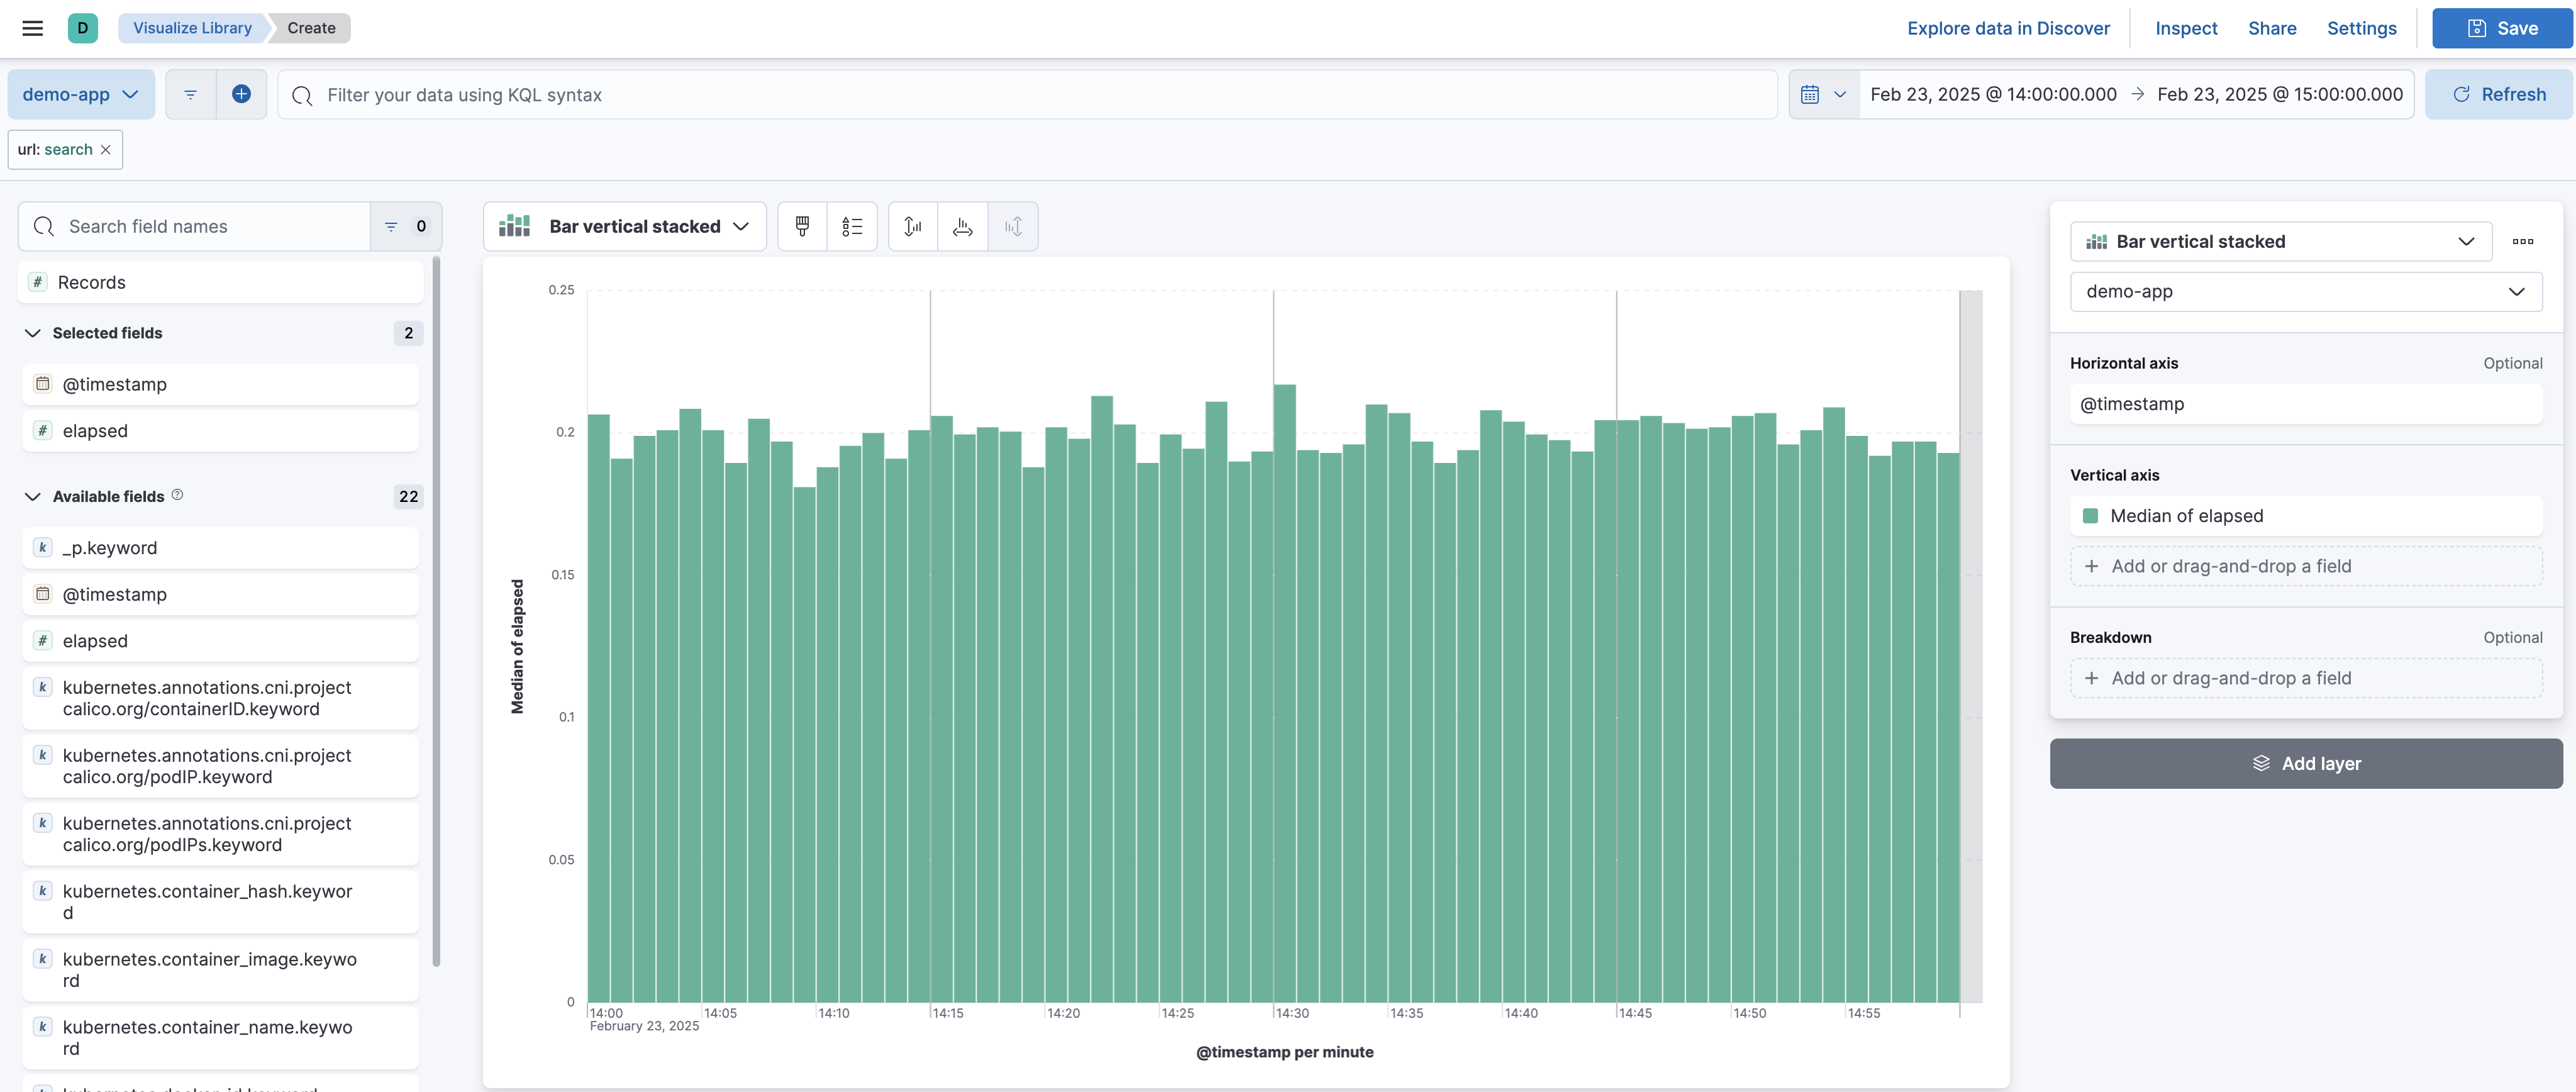
Kibana automatically plots the median elapsed time per minute. With this visualization, you can assess how long the application takes to process requests on average within a given time range. If response times spike unexpectedly, it may indicate performance bottlenecks or increased server load.
Analyzing The Most Viewed Items
To determine which items are most frequently accessed, you can analyze log data from API requests to the /items endpoint.
-
Add a filter for the
urlfield to match theitemsendpoint: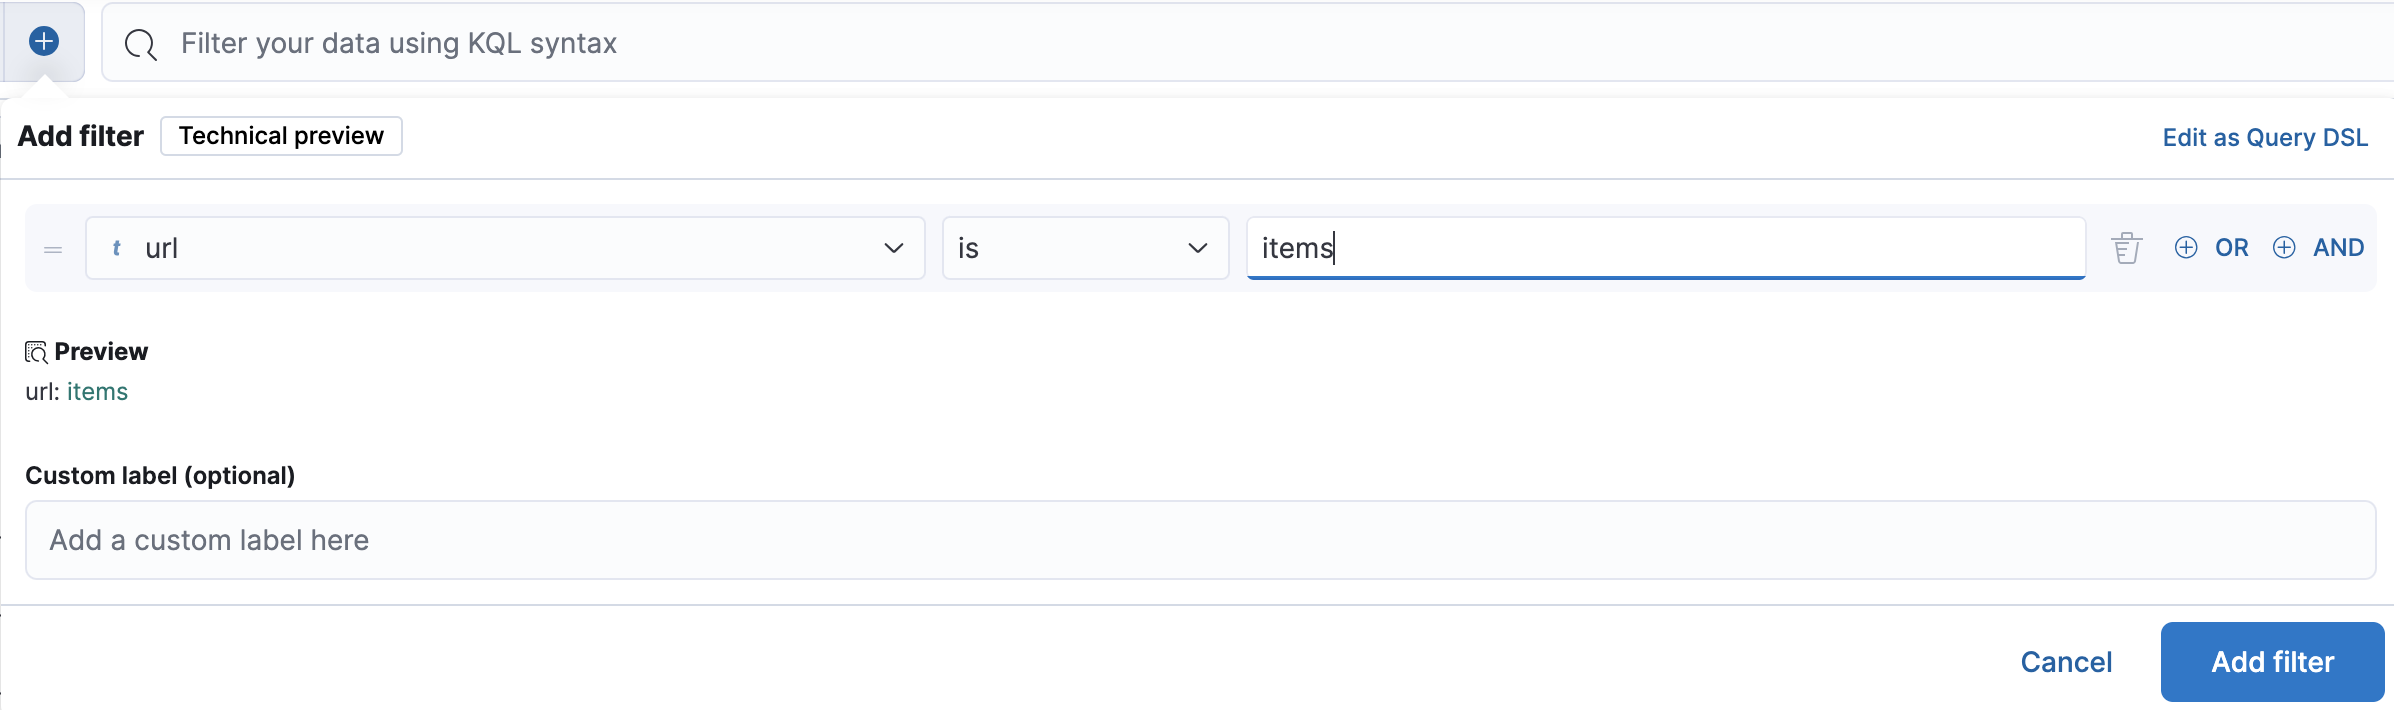
-
Select the
urlfield to group requests by different item paths: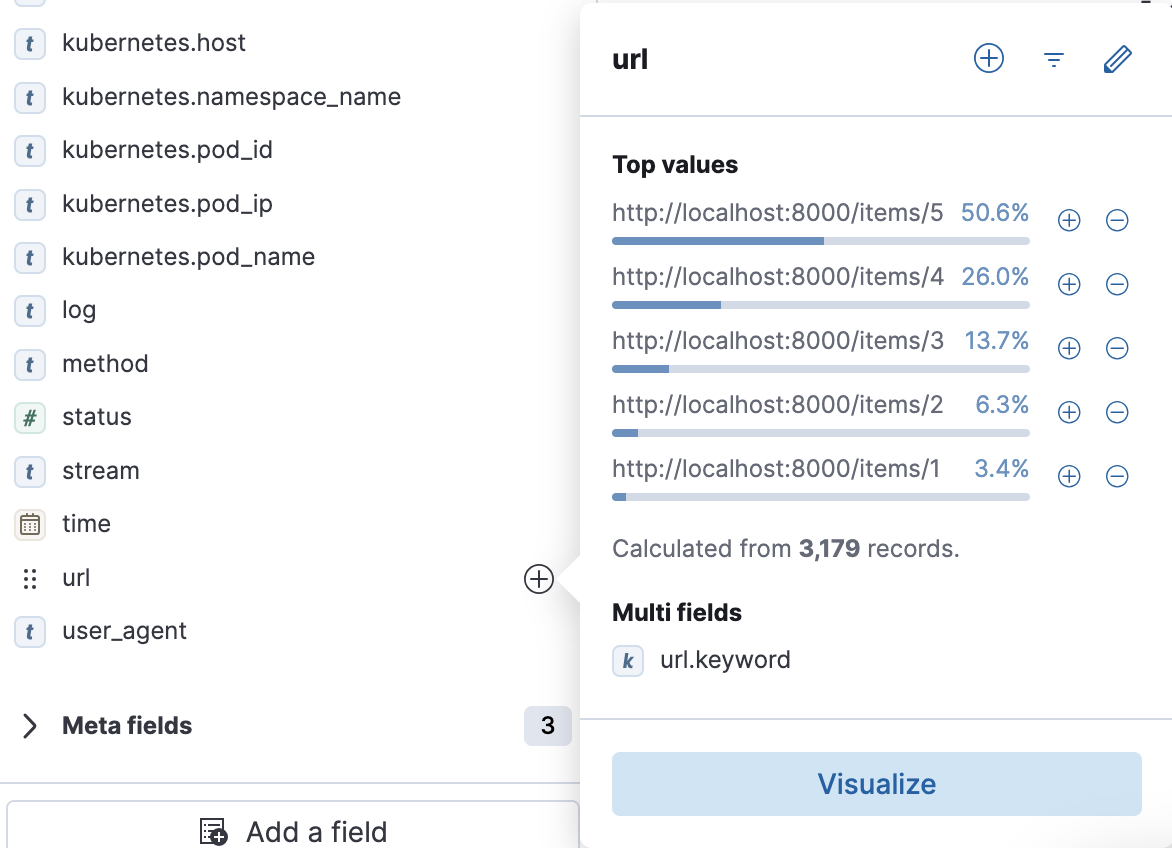
-
Choose
Visualizeto generate chart: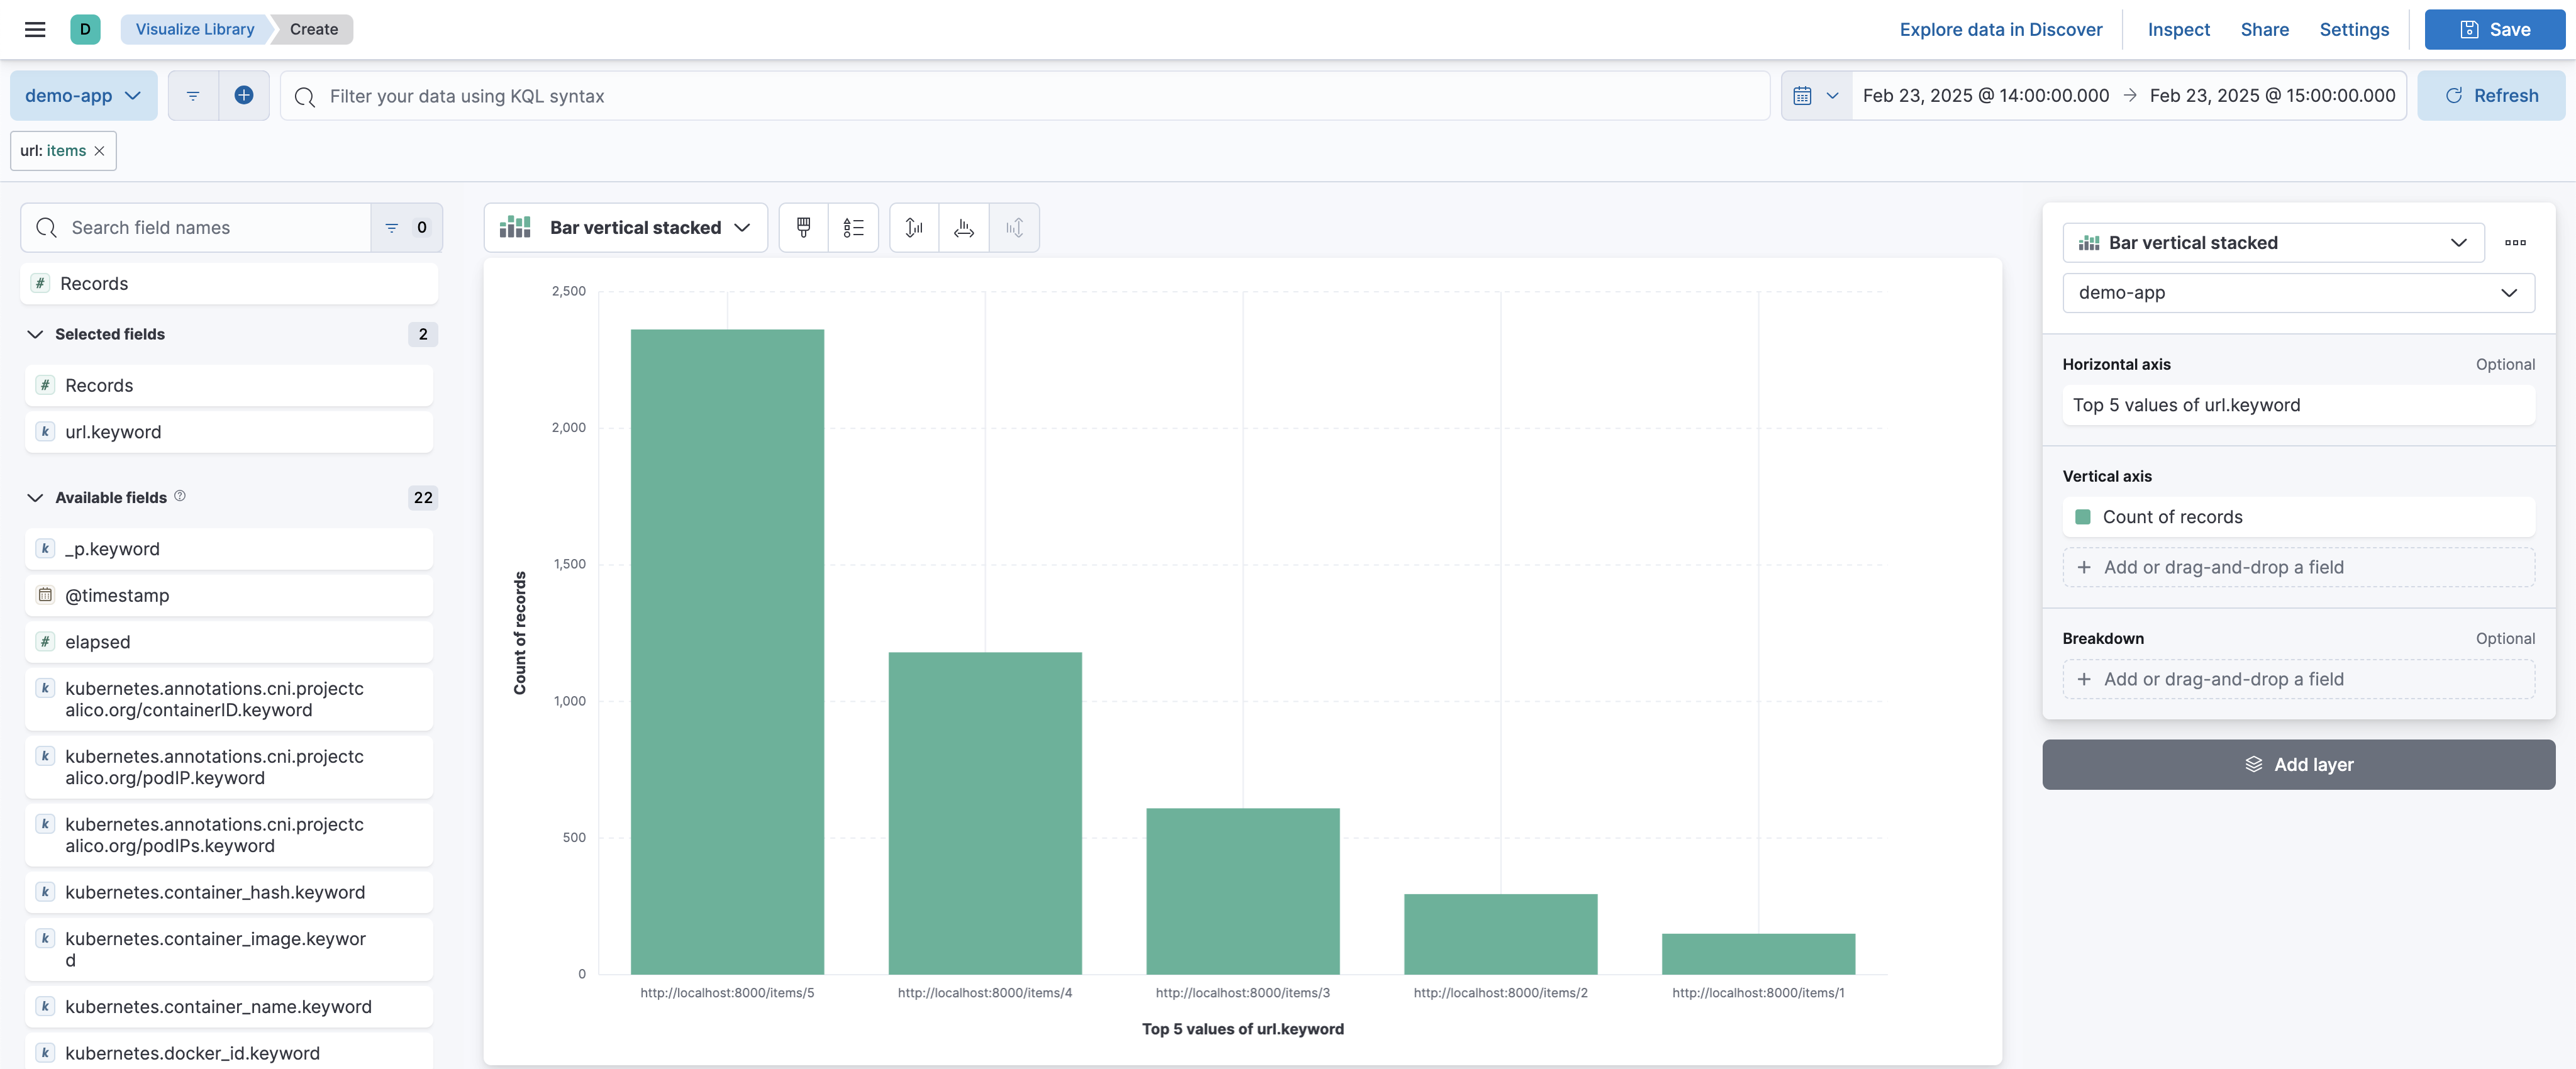
Kibana will display a count of records for each unique item URL. This allows you to identify the most frequently accessed items and gain insights into user behavior. For example, if certain products receive significantly more views, they might be candidates for promotions or featured recommendations.
These are just a few basic examples of how you can leverage Kibana for log analytics.
Kibana offers many more powerful visualization and querying options.
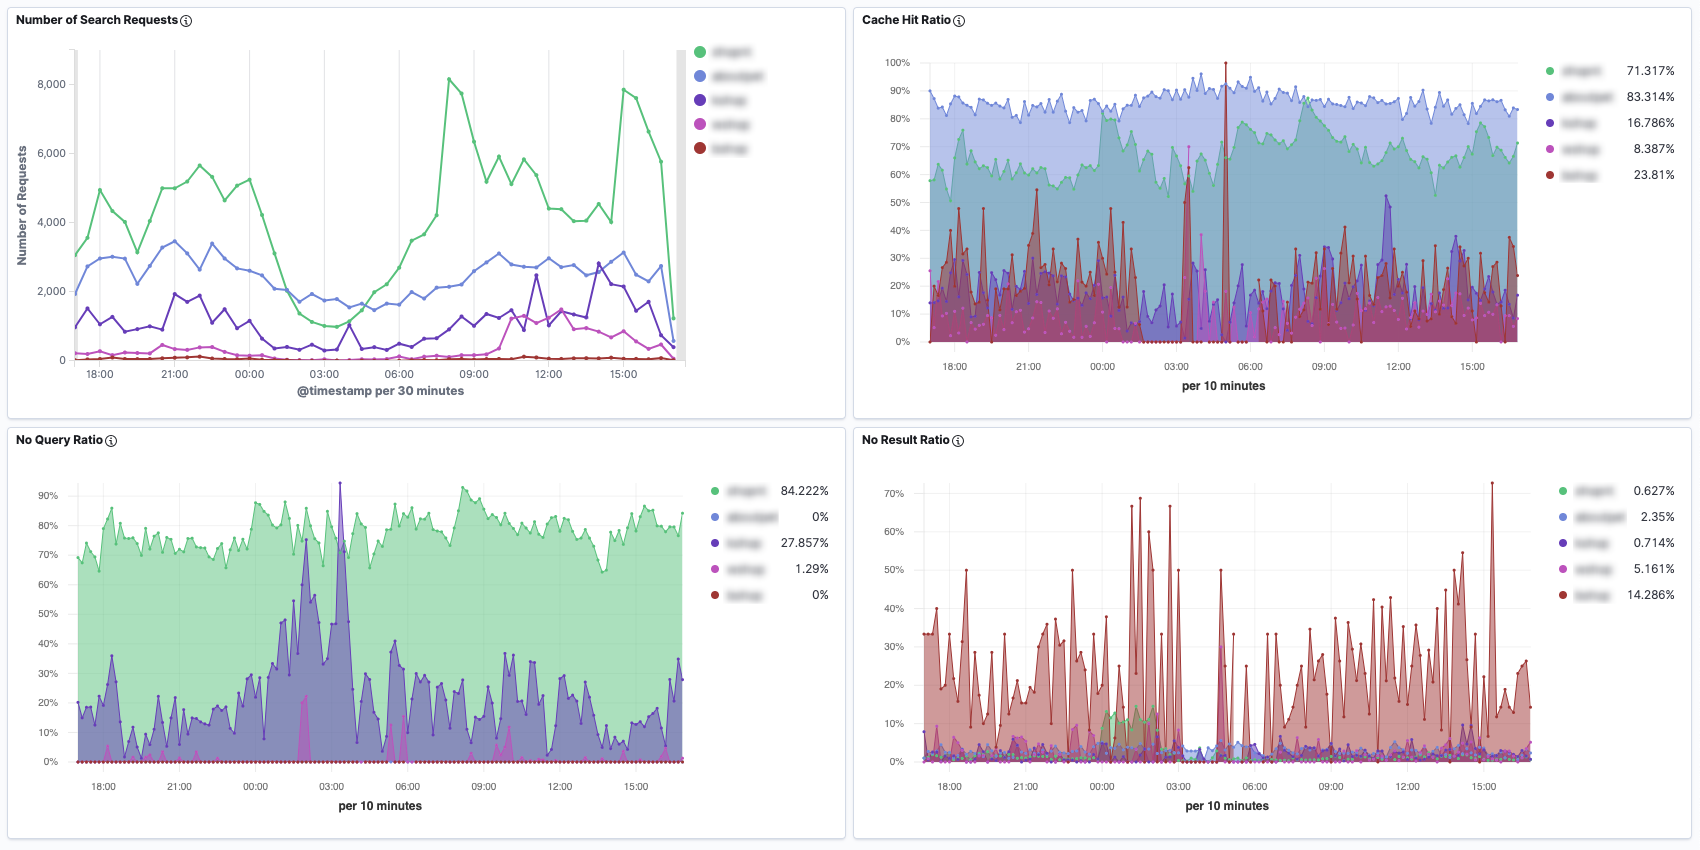
For example, you can create custom visualizations in the Visualize tab and then assemble them into a dashboard in the Dashboard tab:
Troubleshooting
FLuent Bit is Running but New Logs are Not Being Indexed to Elasticsearch
If Fluent Bit is running but logs are not appearing in Elasticsearch, you can debug the issue by enabling tracing in the es output configuration.
[OUTPUT]
    Name es
    ...
    Trace_Output Osn
    Trace_Error On
Trace_Output: When it’sOn, Fluent Bit prints the all ElasticSearch API request payloads for diagnostics.Trace_Error: When it’sOn, Fluent Bit prints the ElasticSearch API request and response for diagnostics.
Run this command to apply the updates:
helm upgrade --install fluent-bit fluent/fluent-bit --values values.yaml
Once these settings are enabled, inspect Fluent Bit’s logs by checking the container logs for detailed diagnostic messages.
One possible cause is a mismatch between Tag and Match.
Ensure that the Tag assigned to incoming logs in Fluent Bit matches the Match property in the output configuration.
Index Health is yellow
If you have set up Elasticsearch using the manifest provided in this guide, it deploys a single-node Elasticsearch cluster.
Because of this, the index health status appears as yellow.
This happens because the default number_of_replicas is set to 1, requiring at least two nodes to ensure redundancy.
Since only one node is available, the replica shards cannot be assigned, leading to a yellow status.
To resolve this and turn the index health status to green, you need to manually update the index settings to remove replicas by running the following command:
PUT /demo-app-*/_settings
{
  "index": {
    "number_of_replicas": 0
  }
}
To verify the current replica settings, use:
GET demo-app-*/_settings
The Value of stream is stderr. Is this a Problem?
If you’re following the demonstration with the FastAPI application I provided, you might notice that logs indexed in Elasticsearch have the stream value set to stderr (standard error).
This behavior occurs because Python’s logging.basicConfig function, by default, creates a StreamHandler that writes logs to sys.stderr.
Although you can configure it to use stdout instead of stderr, this is not necessarily an issue-it depends on how your logging and monitoring setup is designed.
Unintallation
To remove Fluent Bit from your Kubernetes cluster, run the following command:
helm uninstall fluent-bit
Conclusion
With the ability to manage logs from multiple applications and sources, you can eliminate the need for individual applications to explicitly send logs to a centralized storage service like Elasticsearch. Instead, Fluent Bit efficiently handles log collection and forwarding, allowing applications to remain focused on their core functionality.
This separation of concerns provides several benefits:
- Applications can generate logs without worrying about storage or processing bottlenecks.
- Fluent Bit can route logs to multiple destinations, making it easier to adapt to different observability needs.
- Developers can focus on building features while the logging infrastructure ensures reliable data collection.
Additionally, Kibana provides powerful visualization and analysis tools, enabling developers to explore logs, identify patterns, and troubleshoot issues efficiently. Kibana can also help teams gain insights from their log data.
If in-depth application monitoring is required, integrating a dedicated APM (Application Performance Monitoring) tool can be a great option. However, APM solutions tend to consume significant storage due to the additional application context they collect. To optimize storage usage, it’s beneficial to limit retention periods or configure sampling rates to reduce excessive data collection.
A common strategy would be as follows:
- Use the EFbK stack for long-term storage of essential logs.
- Use an APM tool for short-term, high-resolution application performance monitoring.